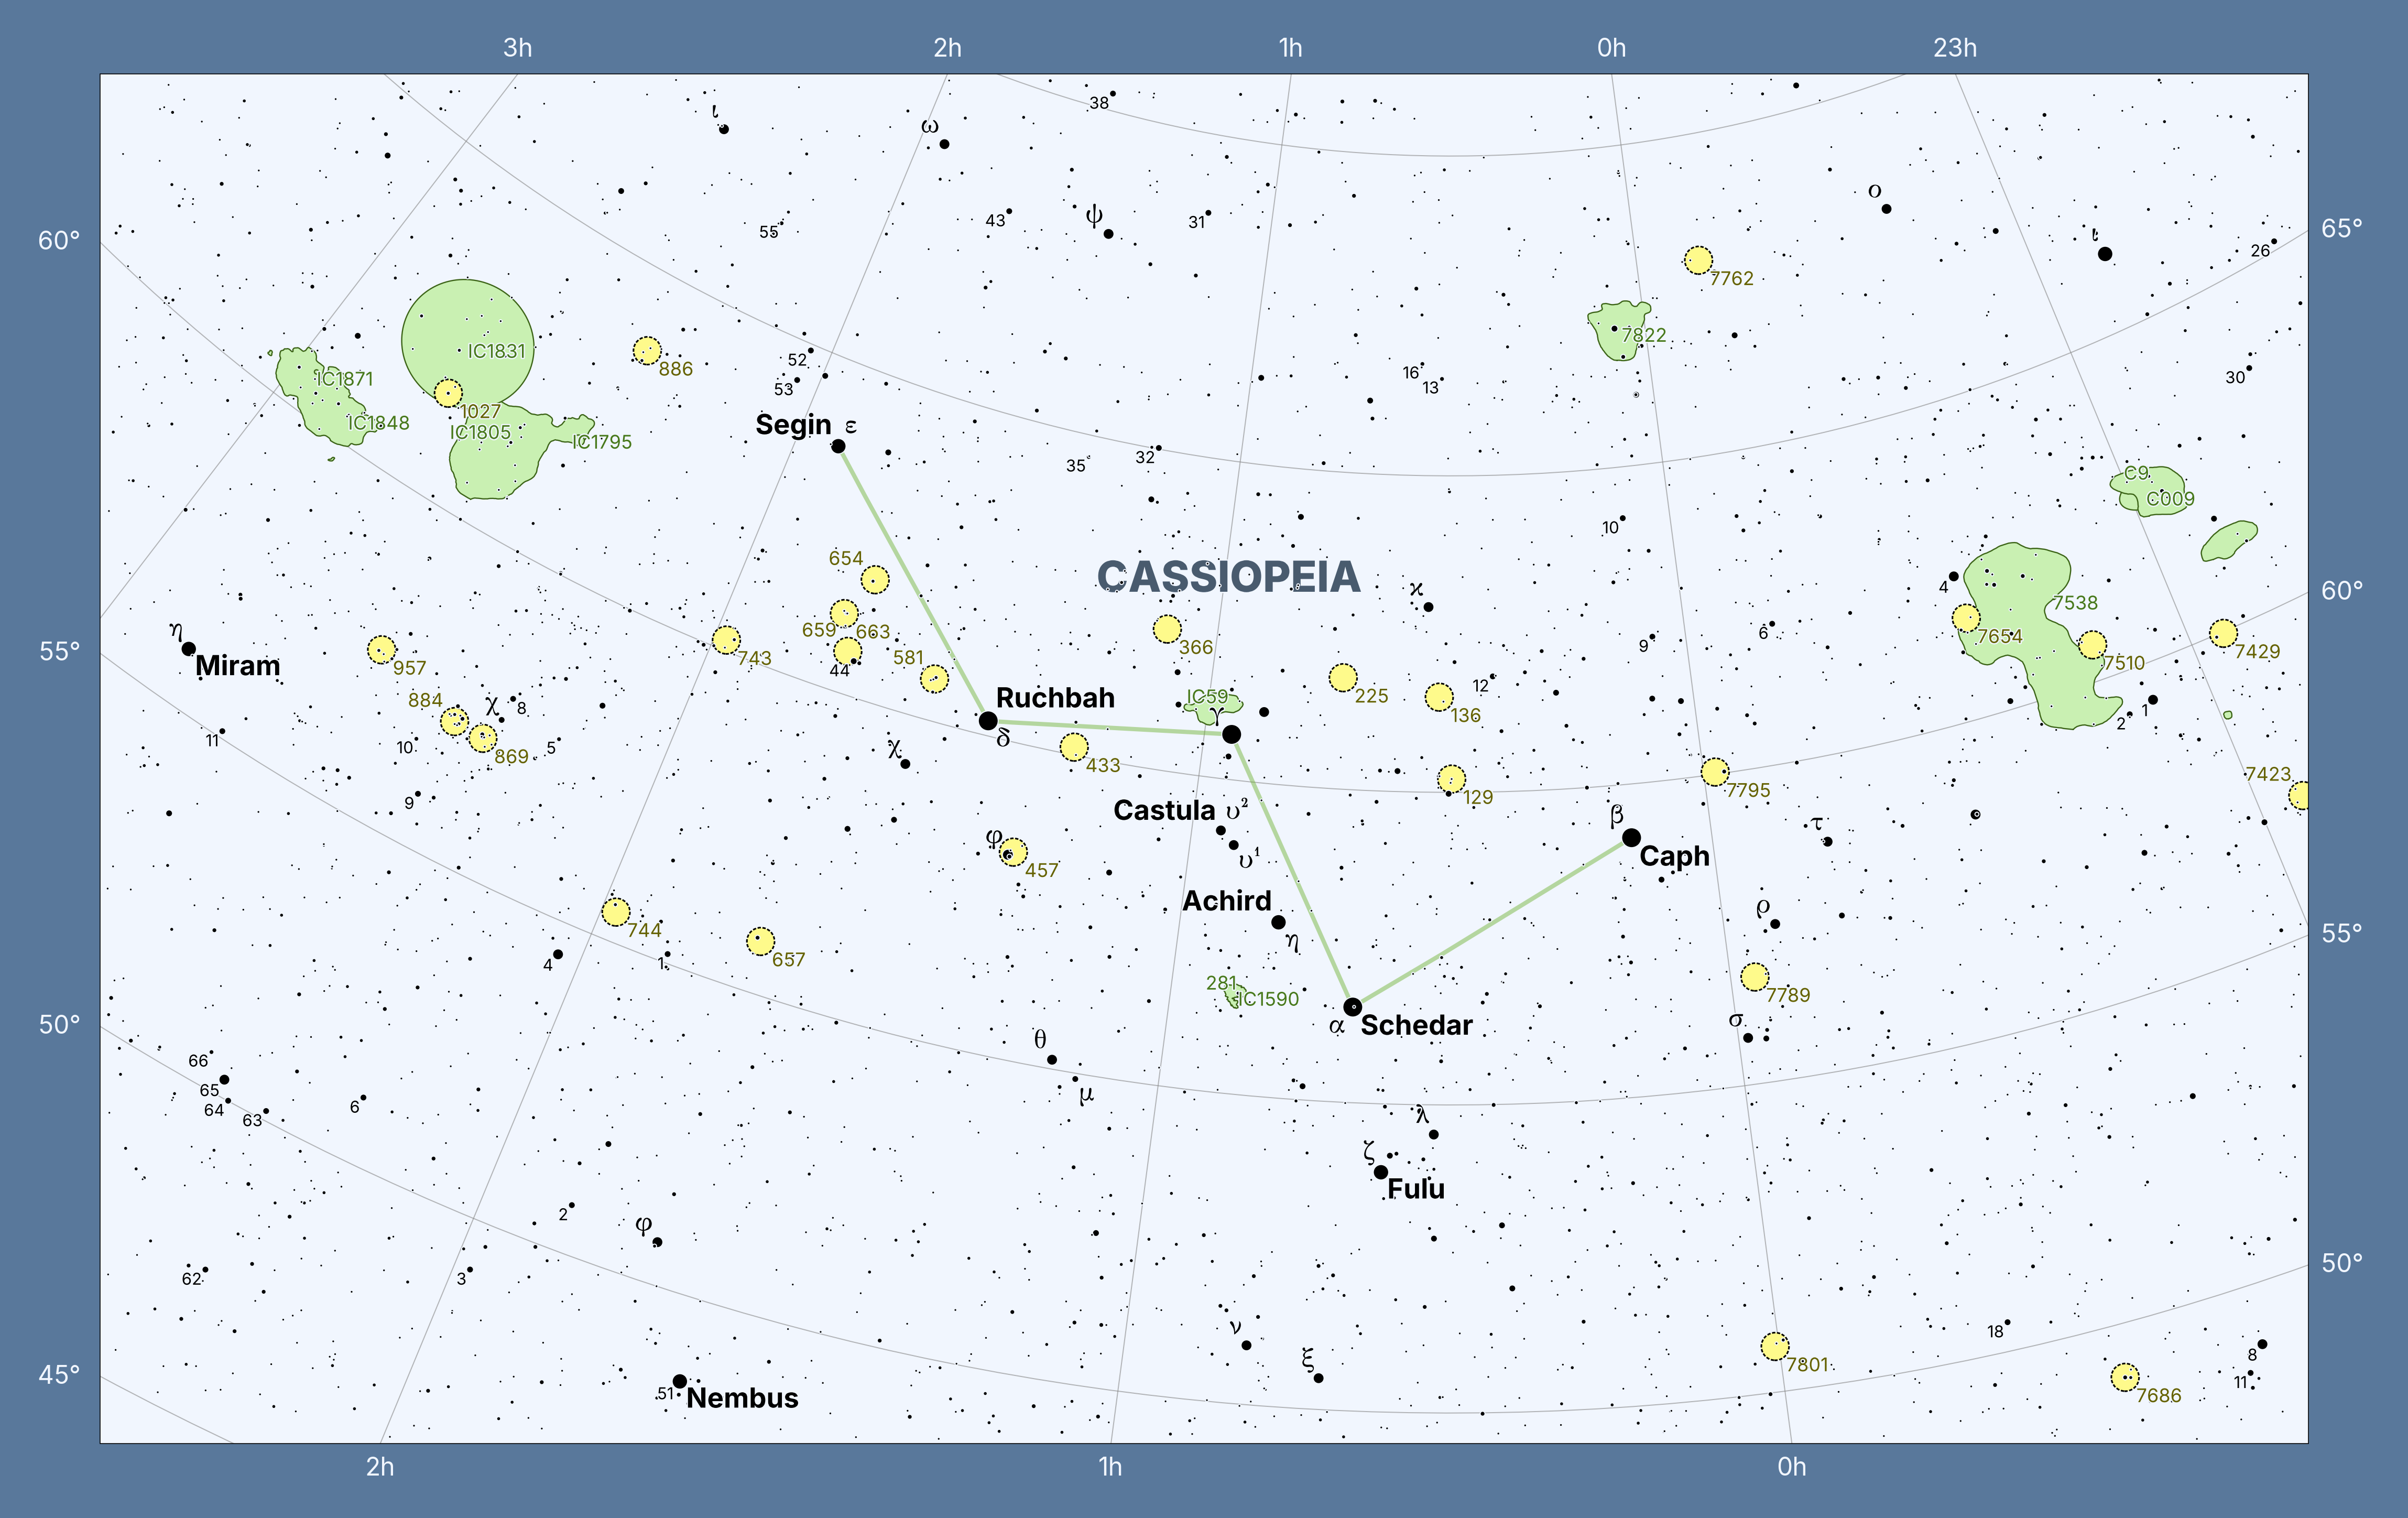
fromstarplotimportMapPlot,LambertAzEqArea,DsoType,_fromstarplot.stylesimportPlotStyle,extensionsstyle=PlotStyle().extend(extensions.BLUE_MEDIUM,extensions.MAP,)p=MapPlot(projection=LambertAzEqArea(center_ra=0.5*15,center_dec=90),ra_min=23.21*15,ra_max=26.6*15,dec_min=49.5,dec_max=68,style=style,resolution=3600,scale=1.2,)p.constellations(where=[_.iau_id=="cas"])# only plot the lines of Cassiopeiap.stars(where=[_.magnitude<8,],bayer_labels=True,flamsteed_labels=True,)p.dsos(where=[_.type.isin([DsoType.OPEN_CLUSTER.value,DsoType.NEBULA.value,DsoType.EMISSION_NEBULA.value,DsoType.REFLECTION_NEBULA.value,DsoType.HII_IONIZED_REGION.value,DsoType.STAR_CLUSTER_NEBULA.value,]),(_.magnitude.isnull())|(_.magnitude<8),],where_true_size=[_.size>1],)p.constellation_labels()p.gridlines(dec_locations=[dfordinrange(0,90,5)],)p.export("map_cas.png",padding=0.5)