Star Chart for Time/Location
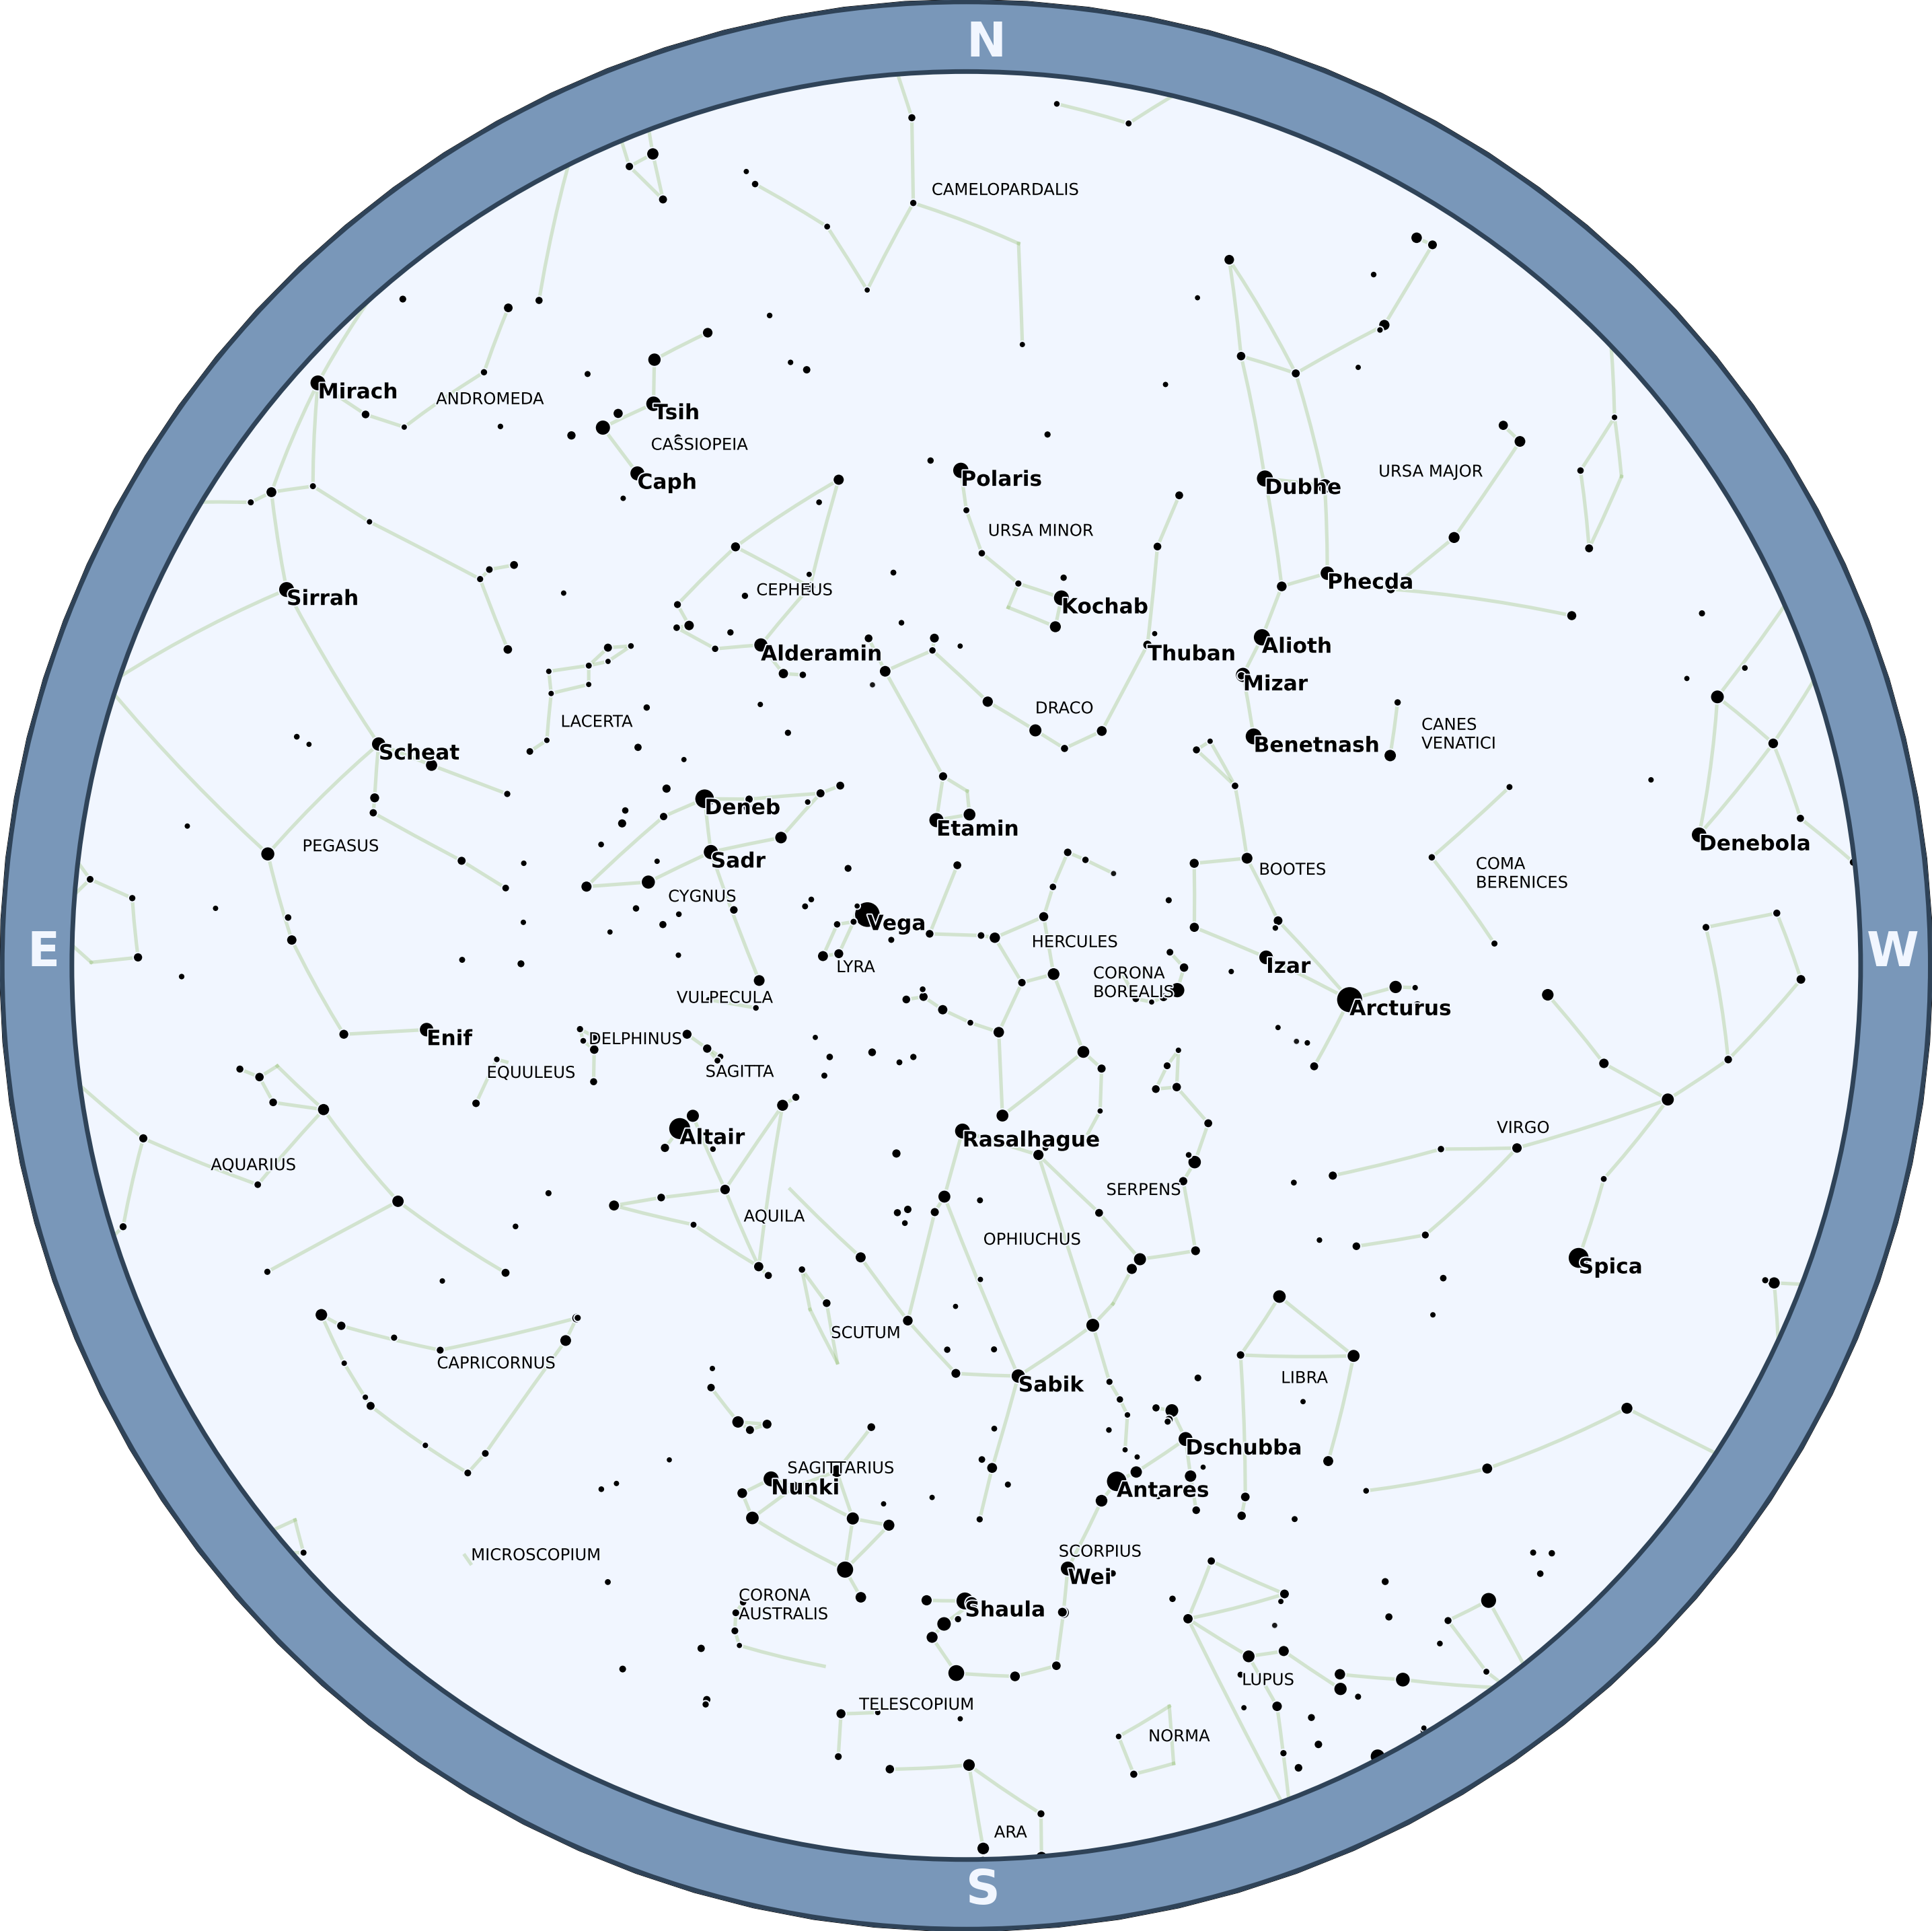
To create a star chart for the sky as seen from Palomar Mountain in California on July 13, 2023 at 10pm PT:
from datetime import datetime
from zoneinfo import ZoneInfo

from starplot import ZenithPlot, Observer, _
from starplot.styles import PlotStyle, extensions

tz = ZoneInfo("America/Los_Angeles")
dt = datetime(2023, 7, 13, 22, 0, tzinfo=tz)  # July 13, 2023 at 10pm PT

observer = Observer(
    dt=dt,
    lat=33.363484,
    lon=-116.836394,
)

p = ZenithPlot(
    observer=observer,
    style=PlotStyle().extend(
        extensions.BLUE_MEDIUM,
    ),
    resolution=3600,
    autoscale=True,
)
p.horizon()
p.constellations()
p.stars(where=[_.magnitude < 4.6], where_labels=[_.magnitude < 2.4])
p.constellation_labels()

p.export("star_chart_basic.png", transparent=True, padding=0.1)