Welcome to Starplot


Starplot is a Python library for creating star charts and maps of the sky
-
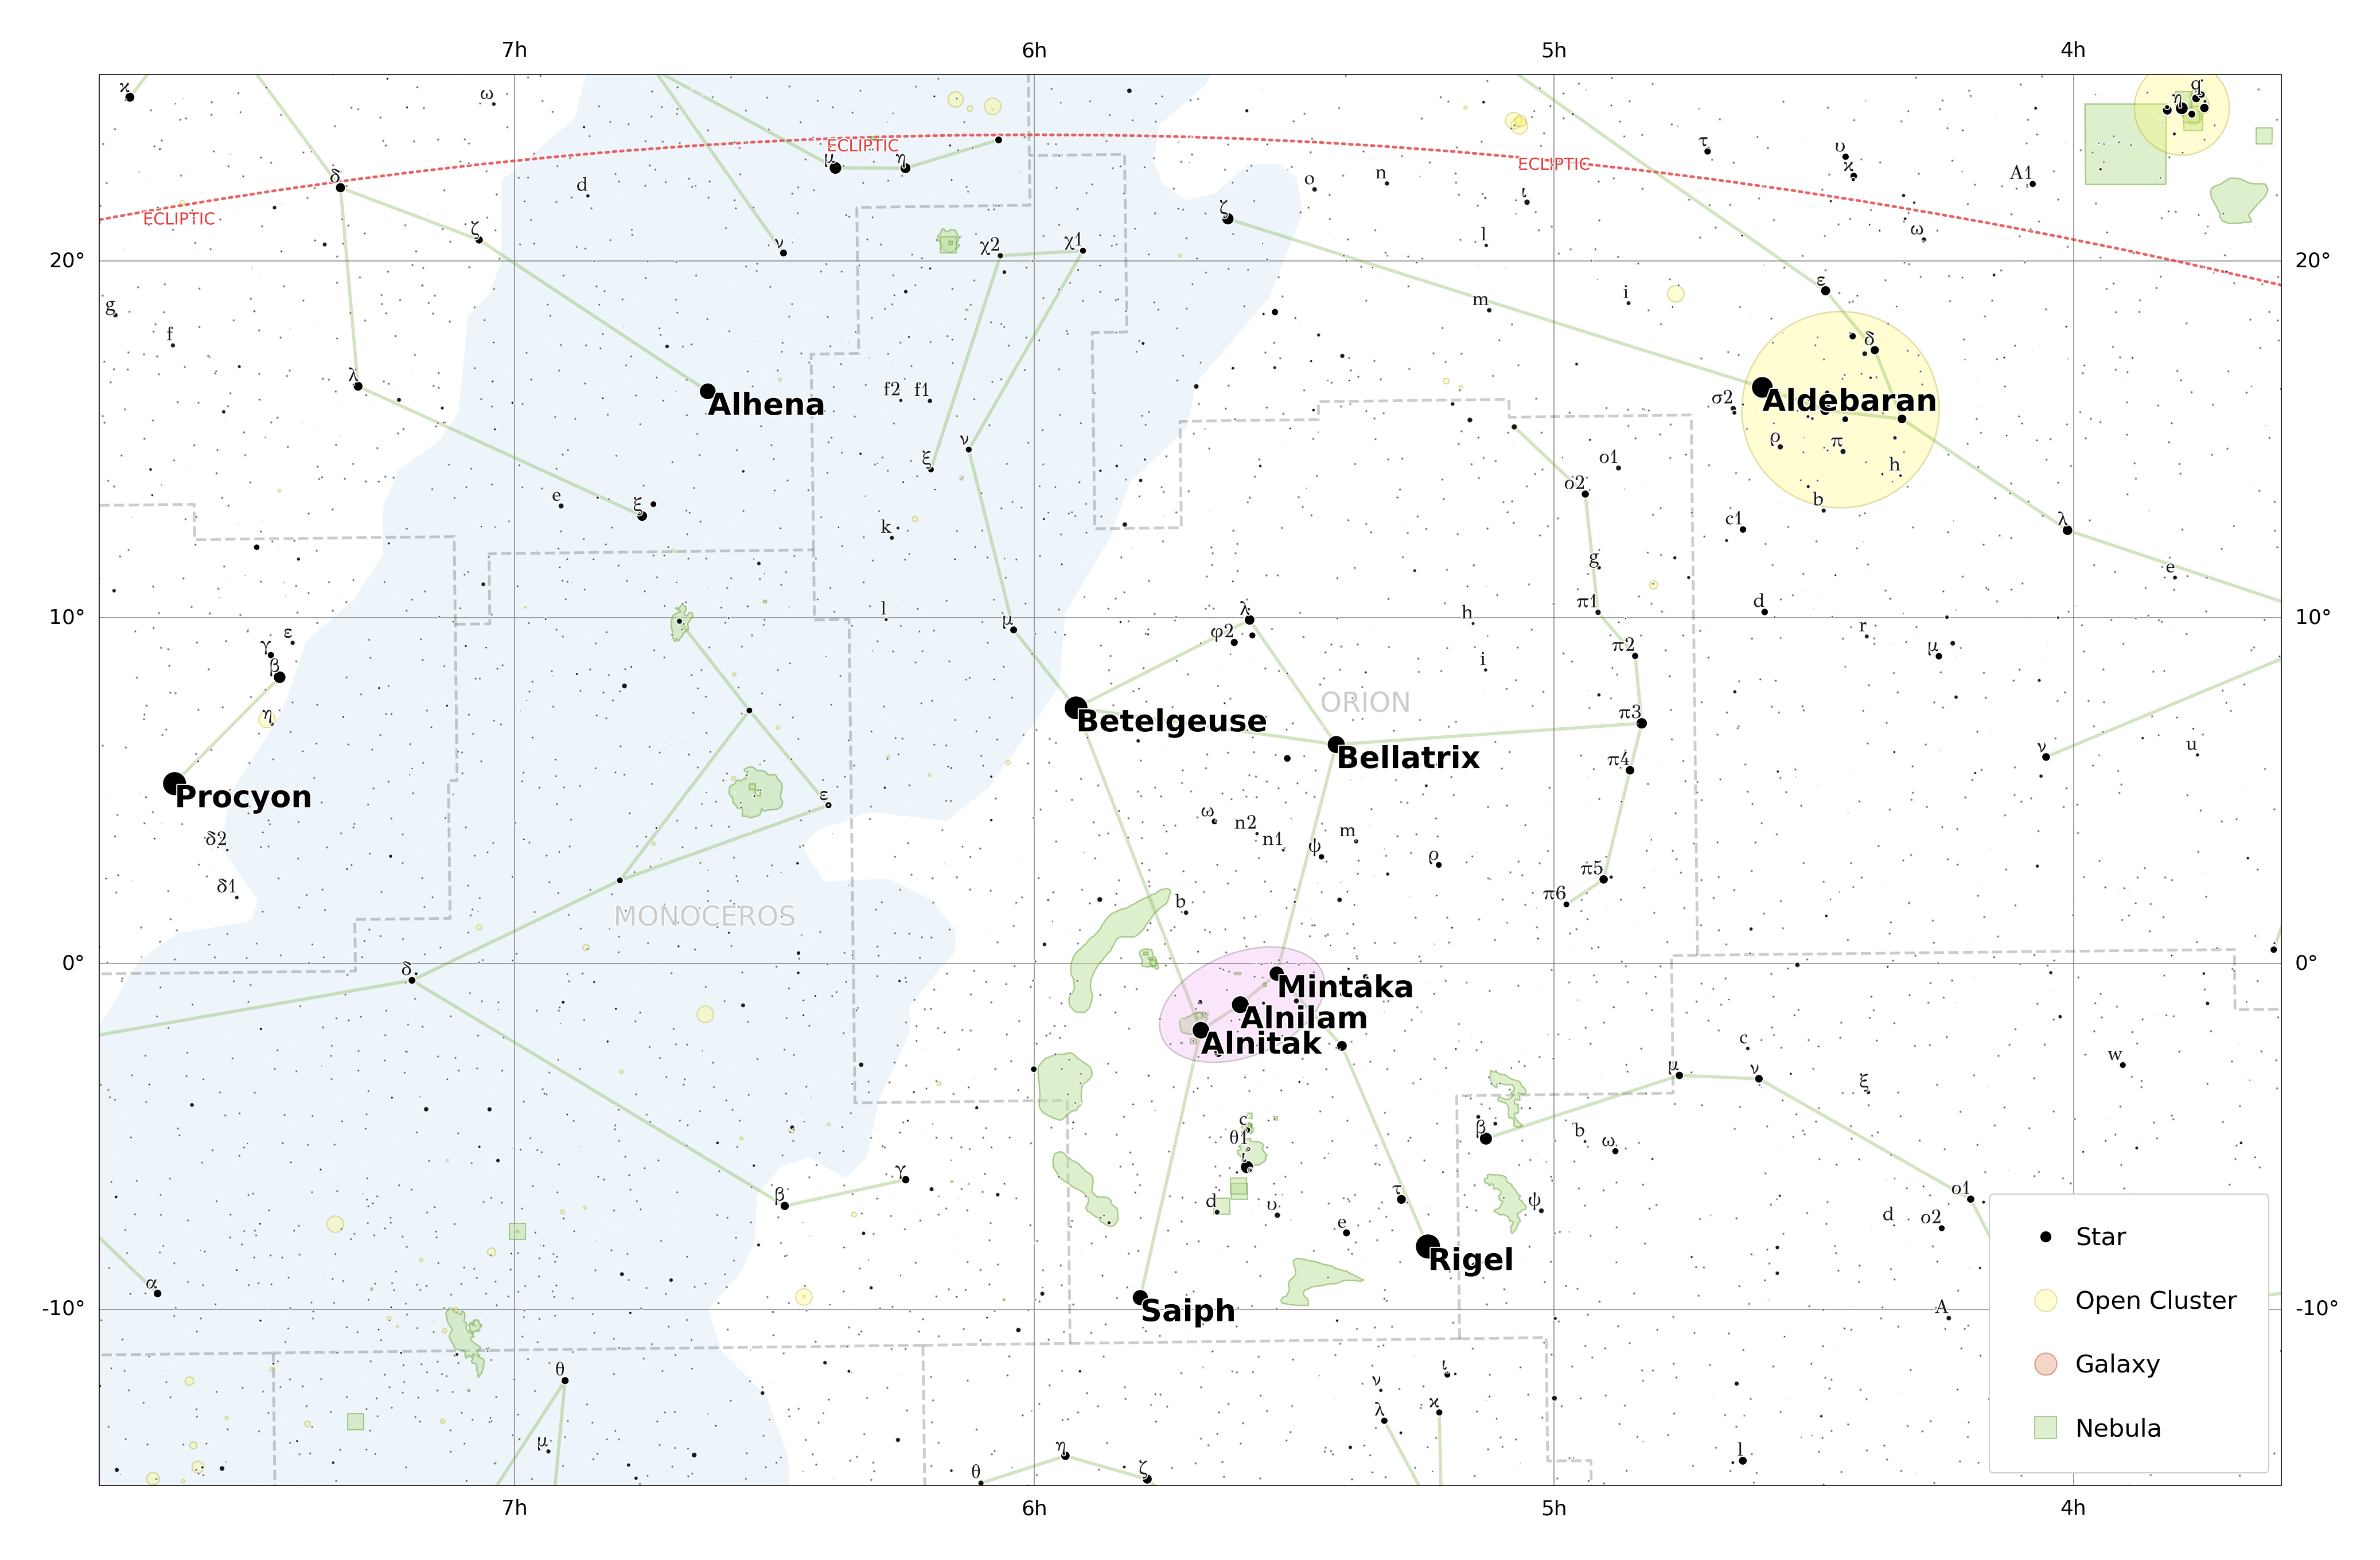
🗺️ Maps - including 10+ customizable projections
-
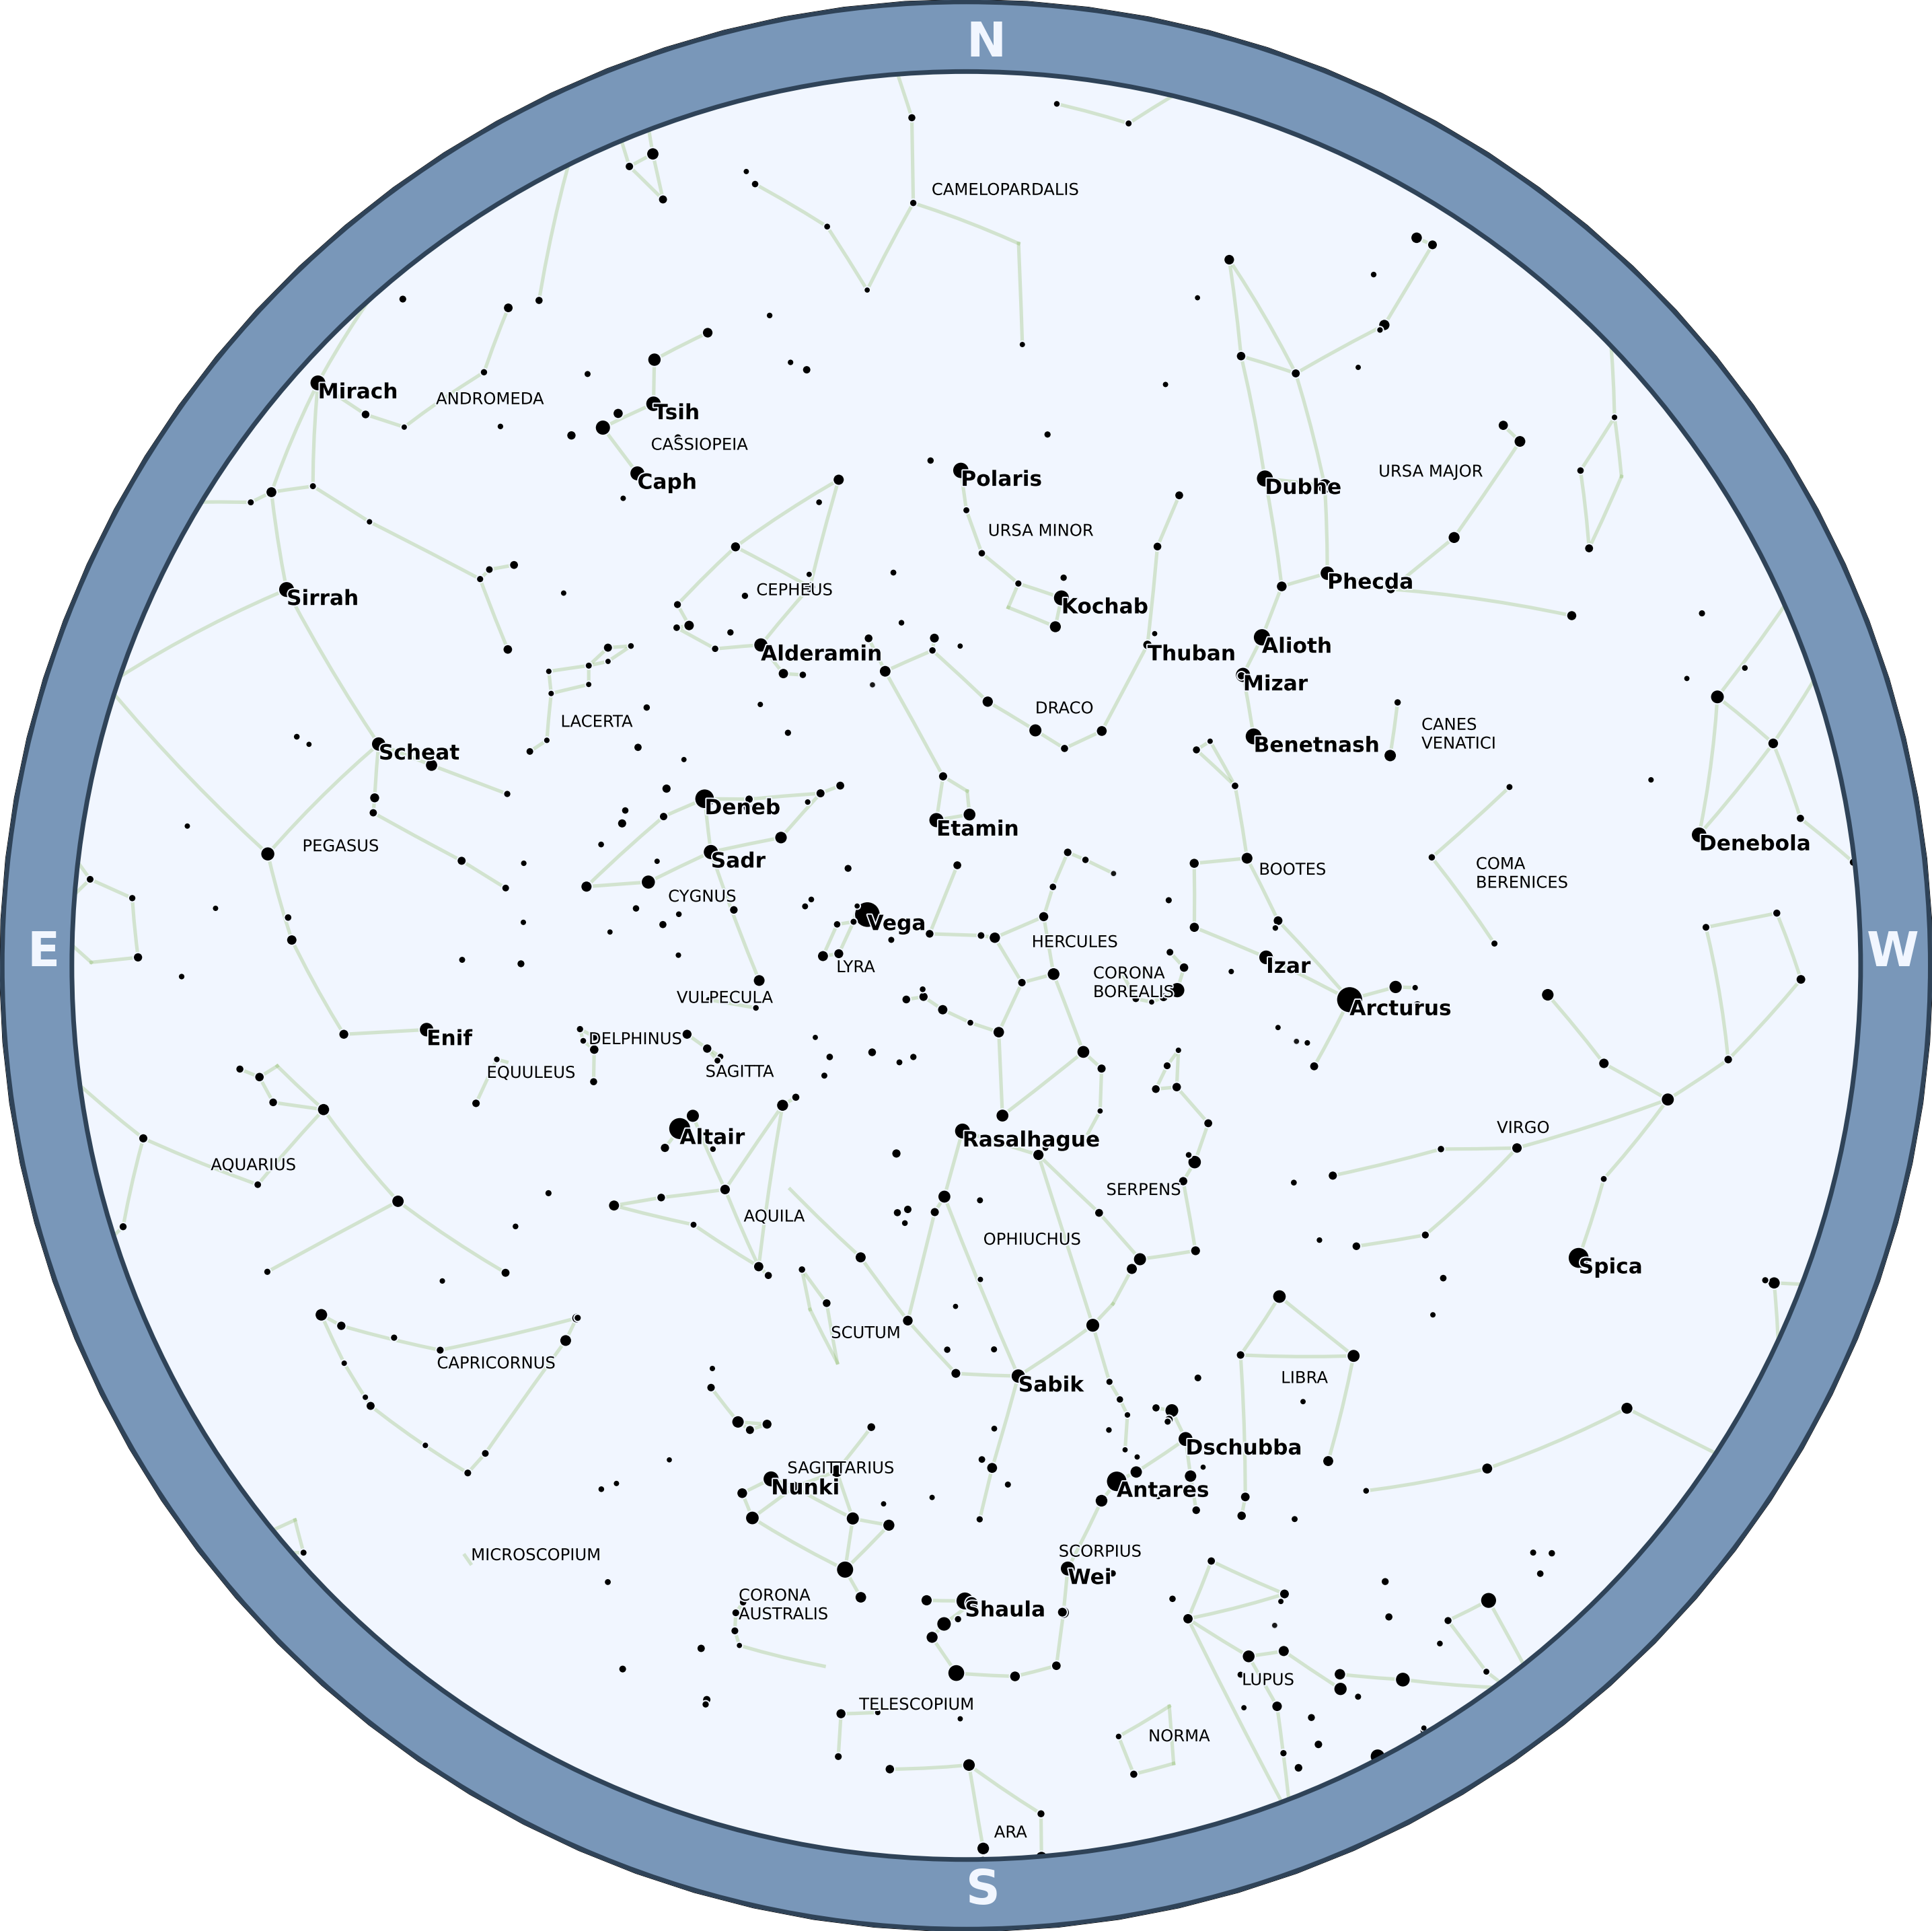
⭐ Zenith Charts - shows the entire sky at a specific time and place
-
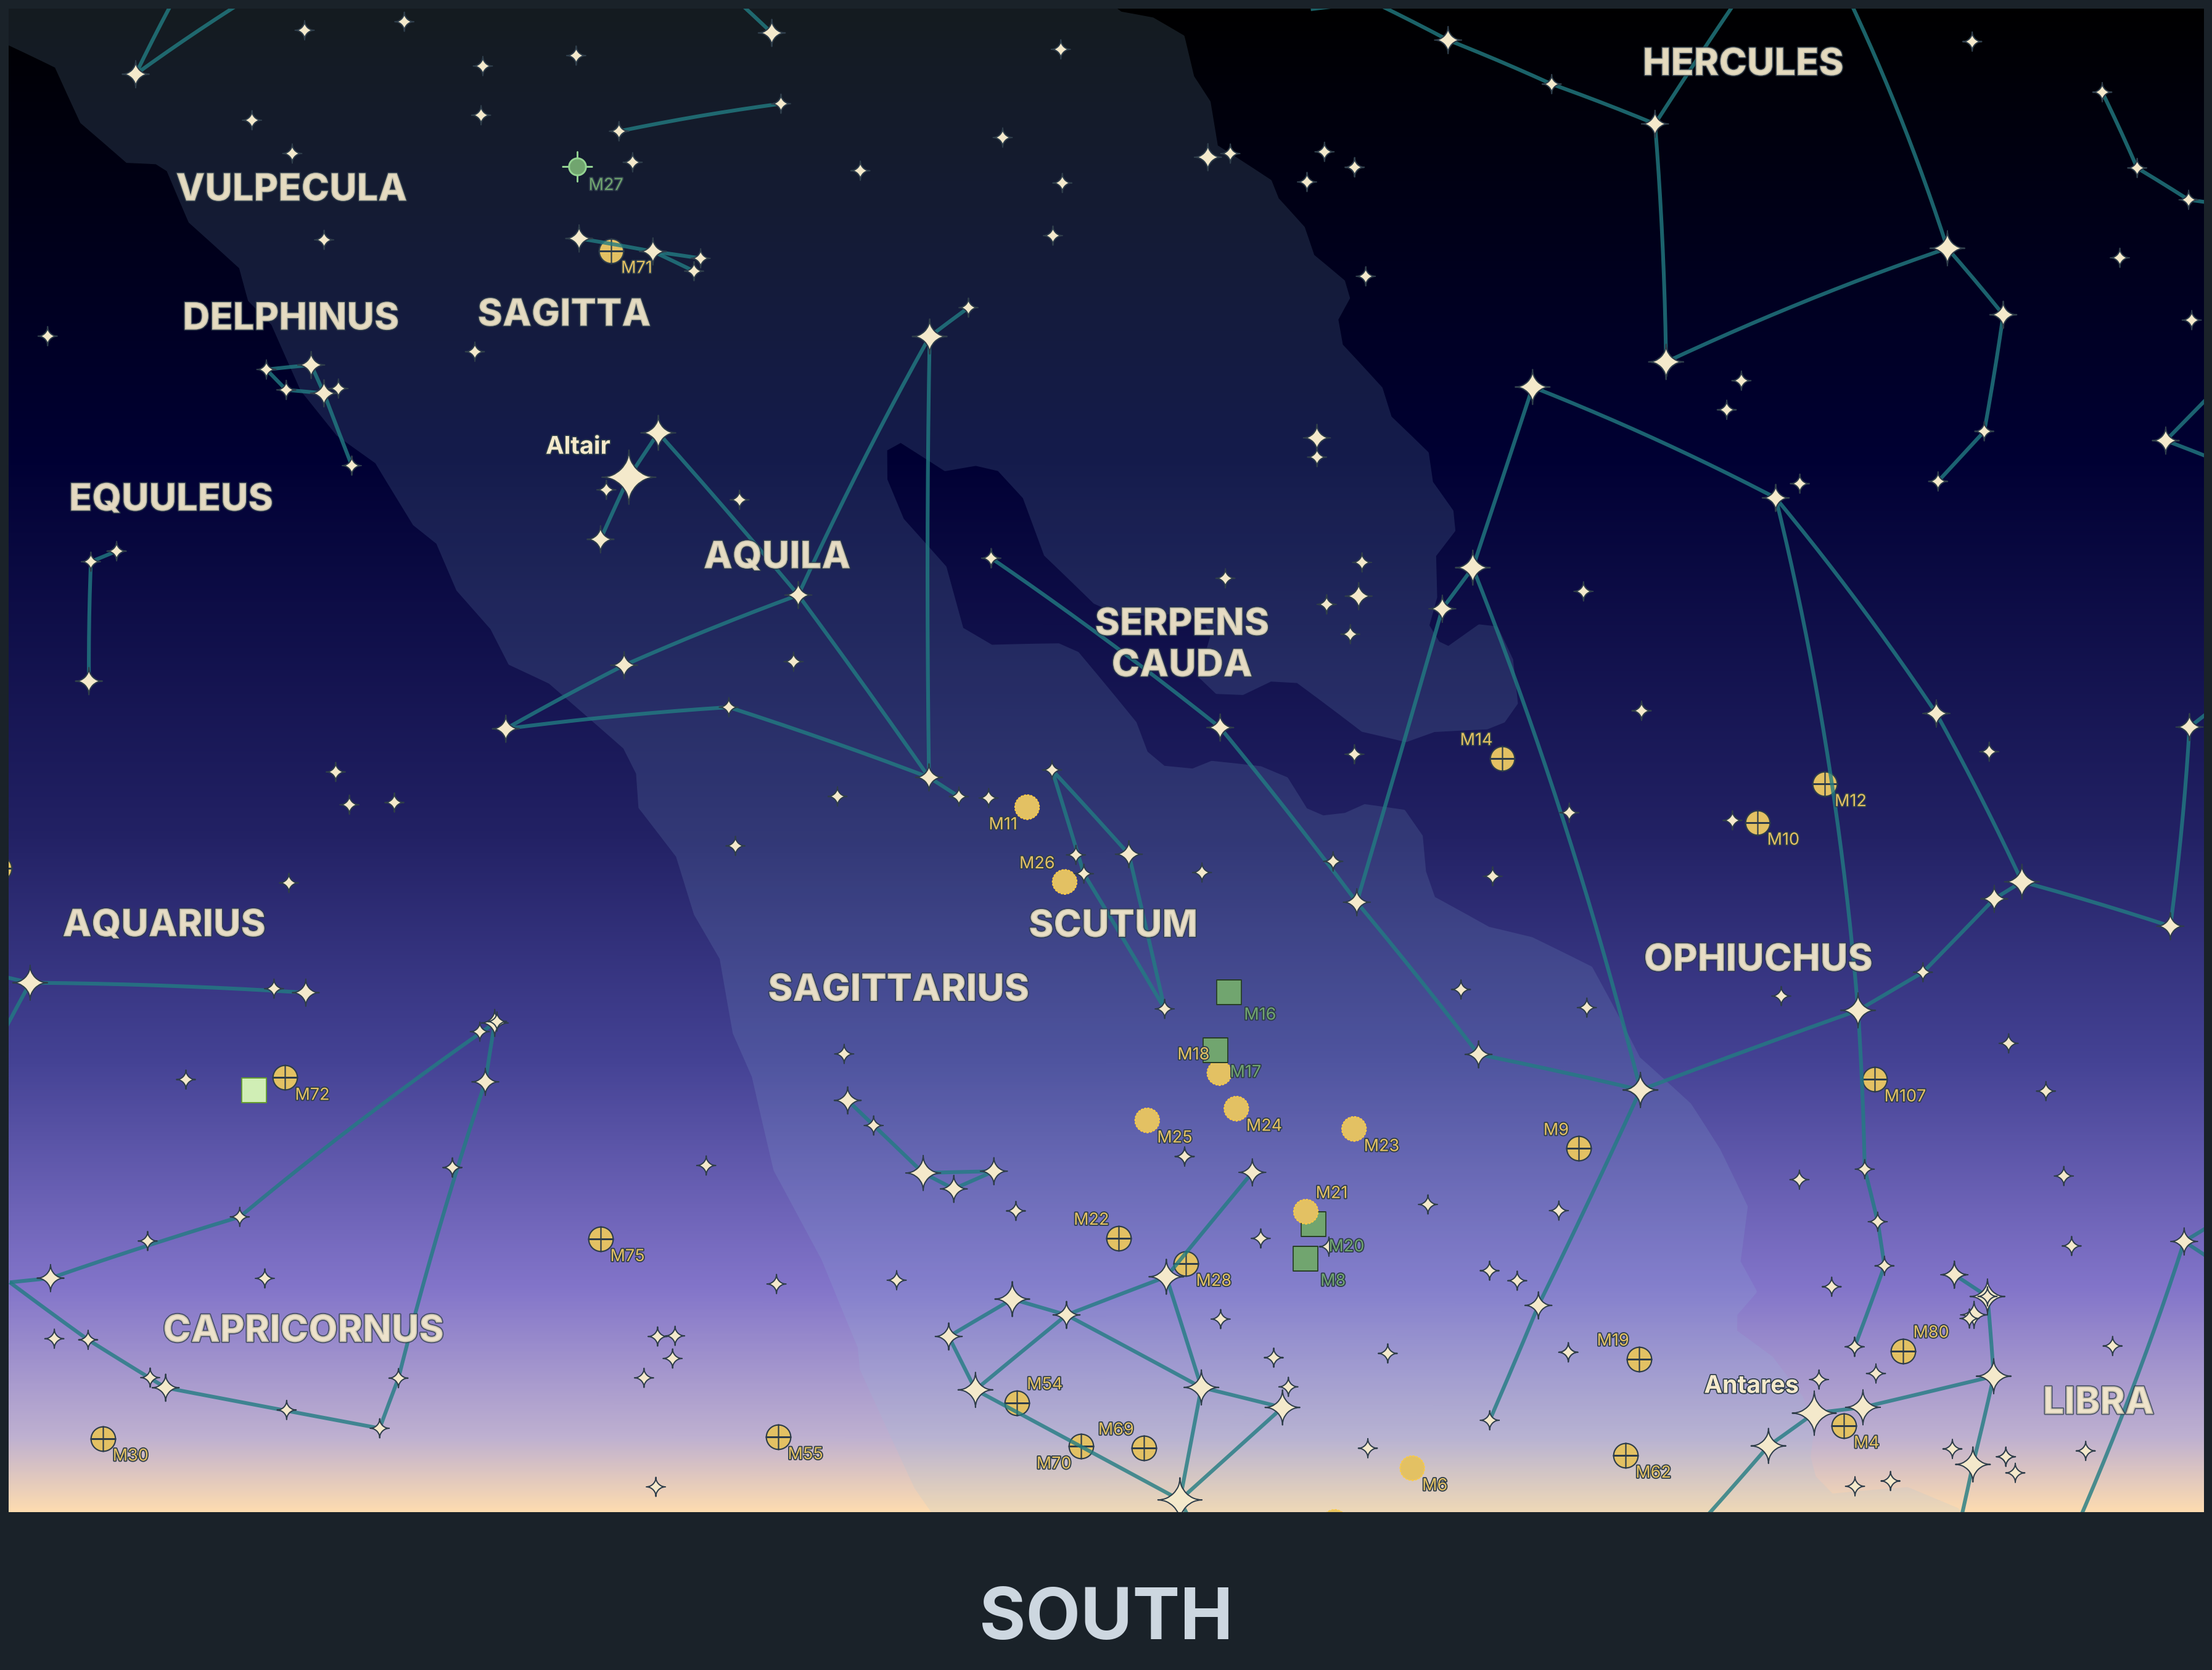
🌅 Horizon Charts - shows the horizon at a specific time and place
-
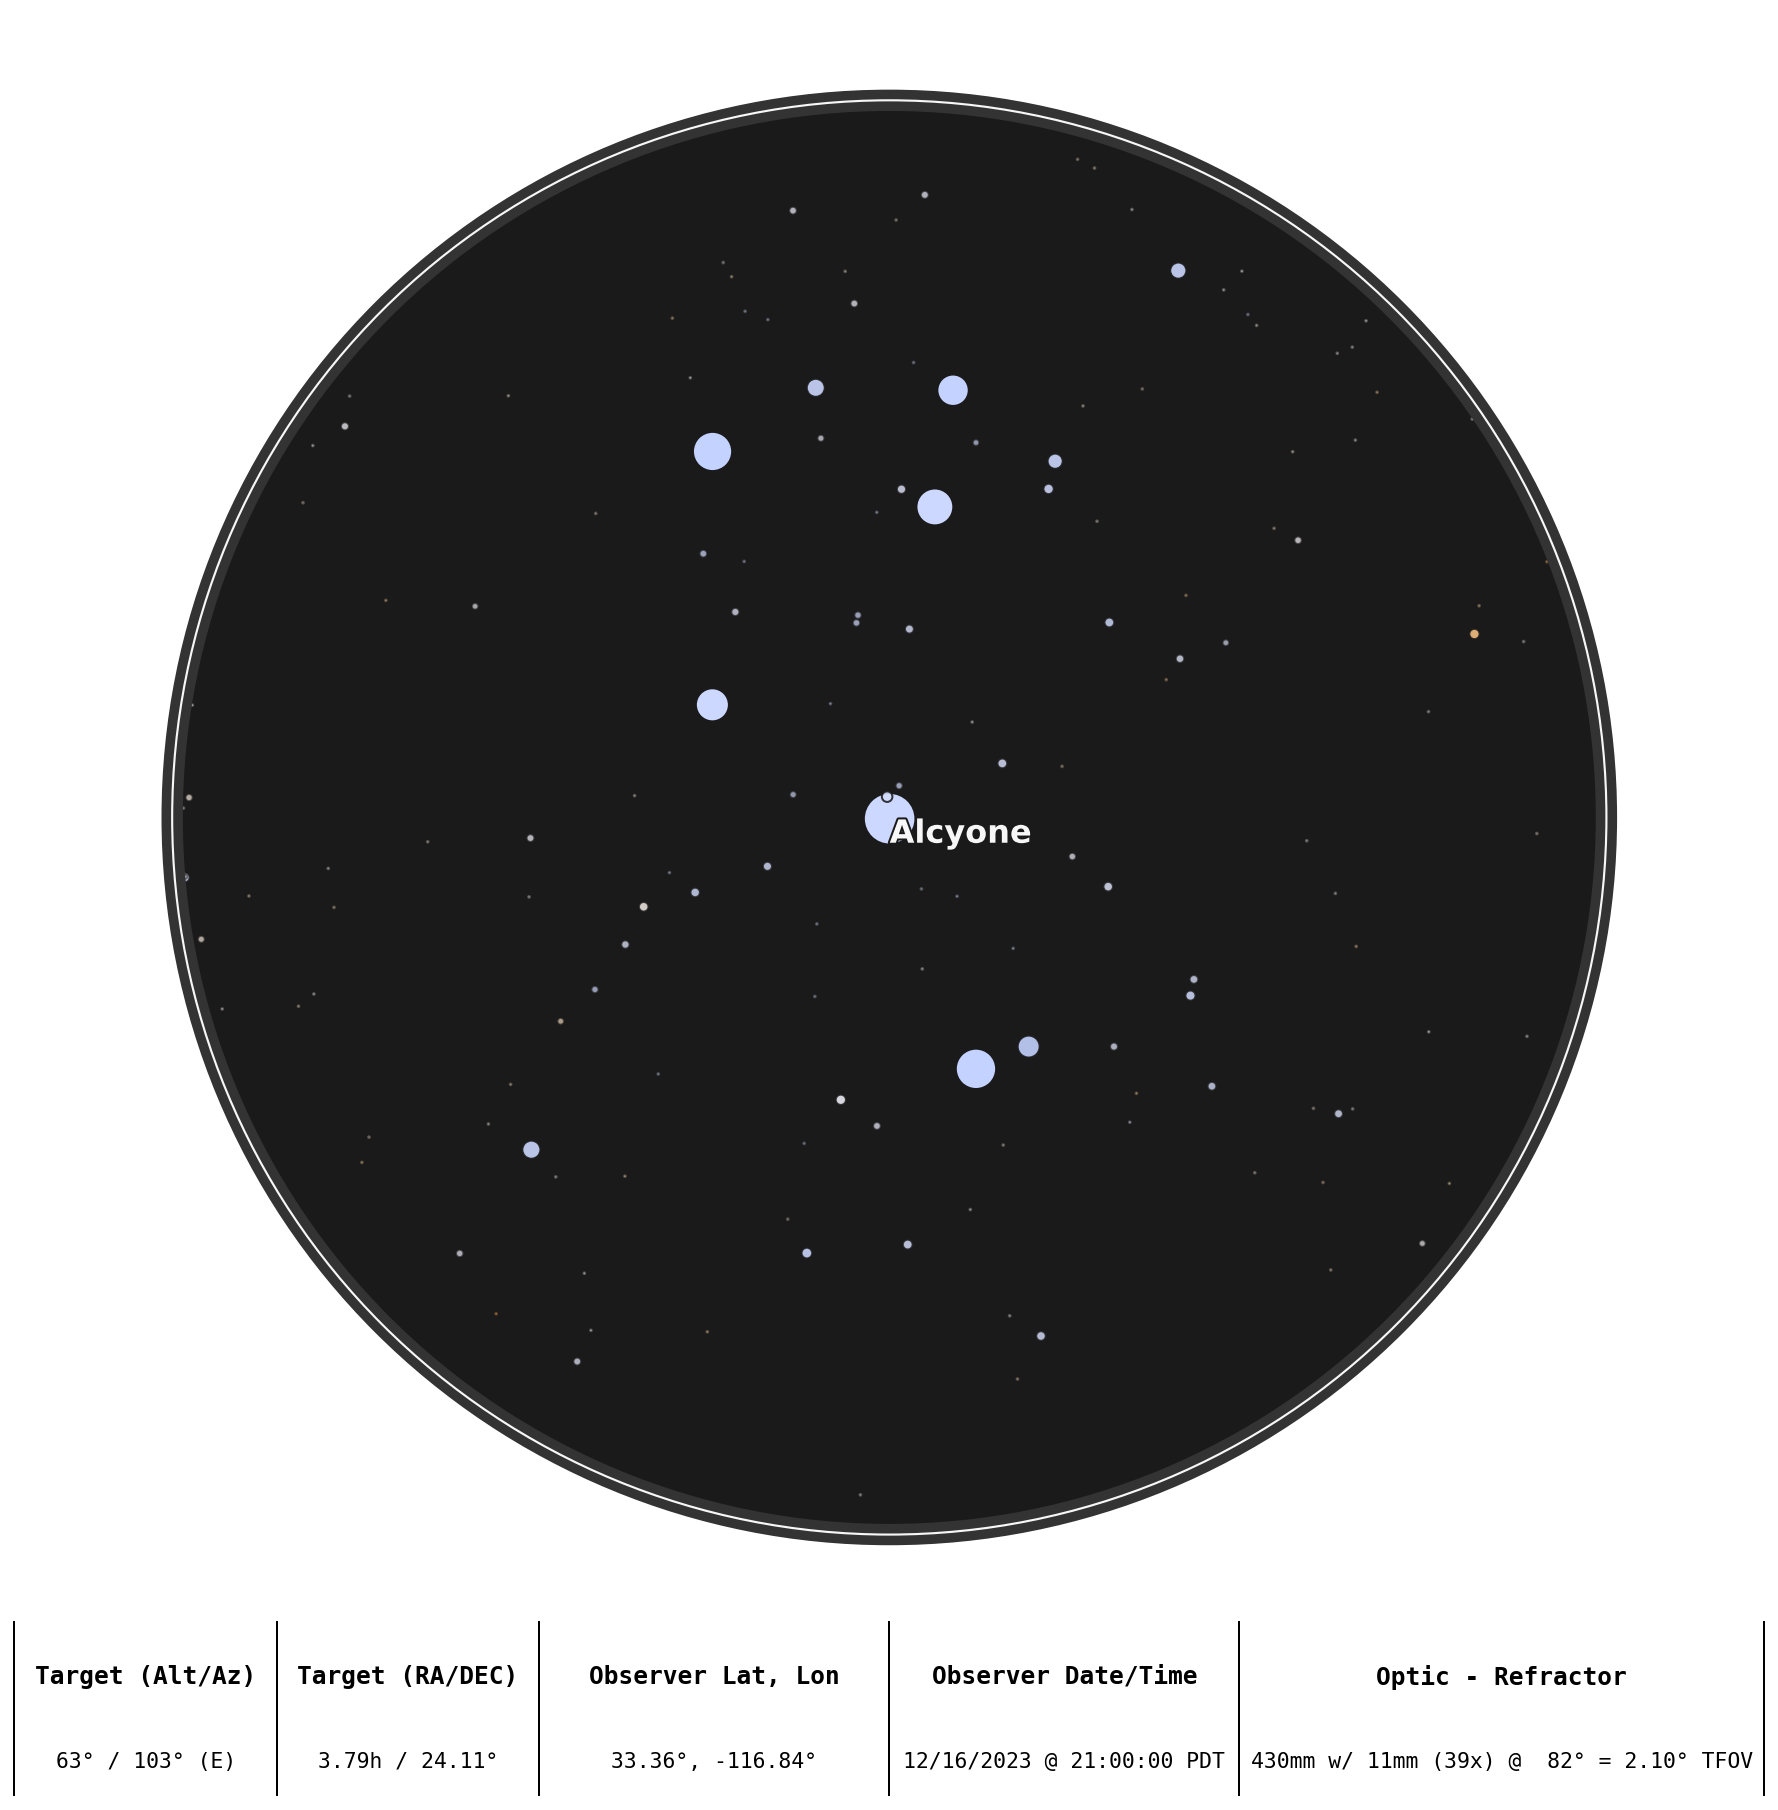
🔭 Optic Simulations - shows what you'll see through an optic (e.g. telescope) at a specific time and place
-
🌌 Galactic Charts - shows a Mollweide projection in galactic coordinates
-
🪐 Planets and Deep Sky Objects (DSOs) - with support for plotting their true extent
-
☄️ Comets and Satellites - easy trajectory plotting
-
🎨 Custom Styles - for all objects and with 8+ built-in themes
-
📥 Export - png, svg, jpeg
-
🚀 Data Backend - powered by DuckDB + Ibis for fast object lookup
-
📓 Custom Data Catalogs - with helpers for building and optimizing
-
🧭 Label Collision Avoidance - ensuring all labels are readable
-
🌐 Localization - label translations for Chinese, French, Lithuanian, Persian, and Spanish
📬 Join our newsletter
- Get notified when there's a new version of Starplot
- Learn about specific use cases of Starplot
- Help us plan and prioritize features by participating in surveys
Example charts and maps created with Starplot: