2 - Creating a Basic Star Chart
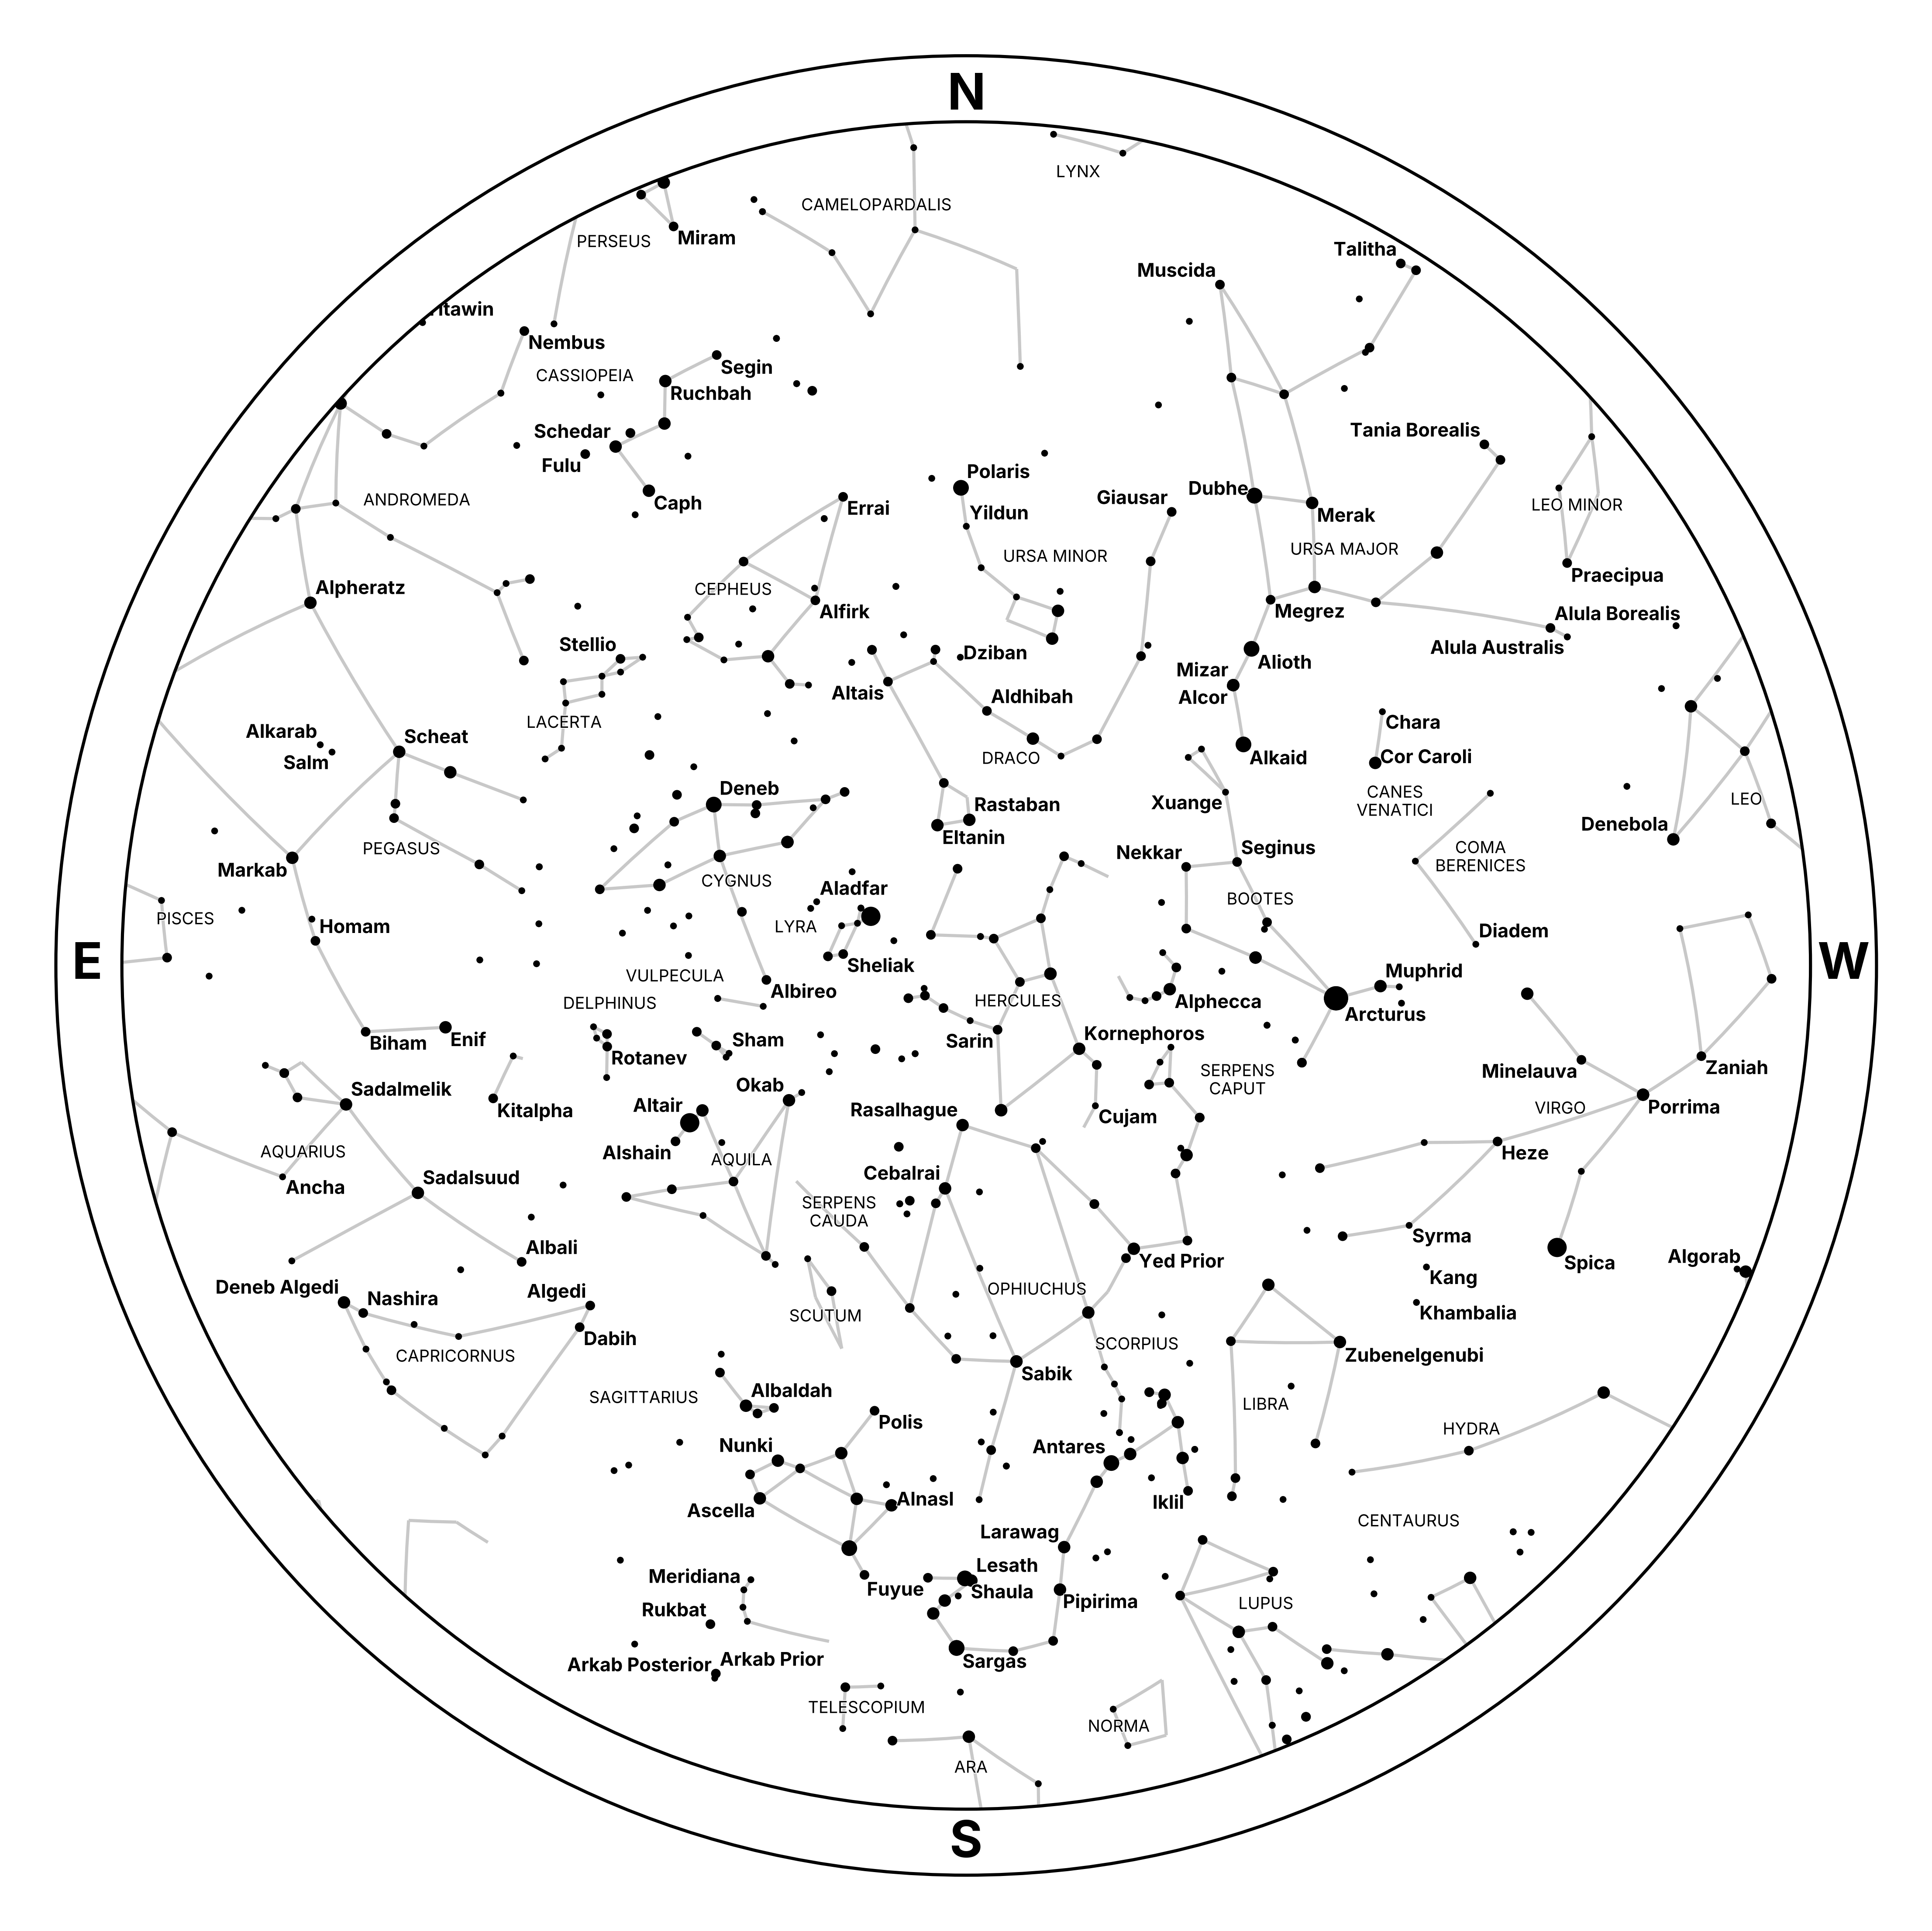
Let's begin our starplotting journey by creating a basic star chart that shows the entire sky at a specific time and place, like the chart above. Starplot calls these "Zenith" plots because the zenith is in the center of the chart.
Here's a look at the code to create the zenith chart above, which shows the sky as seen from Palomar Mountain in California on July 13, 2023 at 10pm PT:
In the first few lines, we just import all the stuff we need.
Next, we create a datetime for our plot, which includes the timezone. All datetime values in Starplot need to be timezone-aware. An exception will be raised if you try to pass a naive datetime.
On line 9, we create an Observer which represents a specific time and place on Earth.
Once we have an observer defined, we create the ZenithPlot instance with a few parameters:
observer: Observer instance that specifies time and locationresolution: Resolution (in pixels) of the widest dimension of the plotscale: This controls the sizing of all text and markers. At scale1.0everything is optimized for a basic map of 1-3 constellations, so if you're plotting a larger area (or just want everything smaller), then it's a good idea to decrease the scale so the plot isn't too crowded.
When you create a plot instance, initially it'll be empty (i.e. it won't have any stars or constellations). In Starplot, you have to explicitly plot all objects.
So, on line 20 we start by plotting the constellation lines. We plot these first, because Starplot can use the constellation lines to automatically find good places to plot object labels.
Next, we plot stars with a limiting magnitude of 4.6 by passing the where argument (you'll learn more about this feature later in the tutorial). Notice how none of the star names in the plot cross over a constellation line? That's because we plotted the constellation lines before plotting the stars.
After the stars, we plot the horizon, which is the border around the plot with the cardinal direction labels.
Lastly, we plot the constellation labels. As mentioned earlier, it's good to plot these last because they're area-based labels (vs point-based, like for star names), and area-based labels have more freedom to move around. If you plot area-based labels first, then it would limit the available space for point-based labels.
Once we're done plotting, we export the plot to a PNG file. Starplot also supports exporting to SVG and JPEG.
When you run this example, if you didn't run starplot setup when installing Starplot then you should see console messages about downloading constellation and star catalogs. Starplot does not include these catalogs in the PyPI package (to save space, and avoid PyPI's size limits), but once they're downloaded Starplot will just use the existing files. You can control where these files are downloaded via the settings.
In the next section, we'll learn how to add some styles and other objects to the plot...