3 - Adding More Details to the Star Chart


Tutorial - Detailed Star Chart

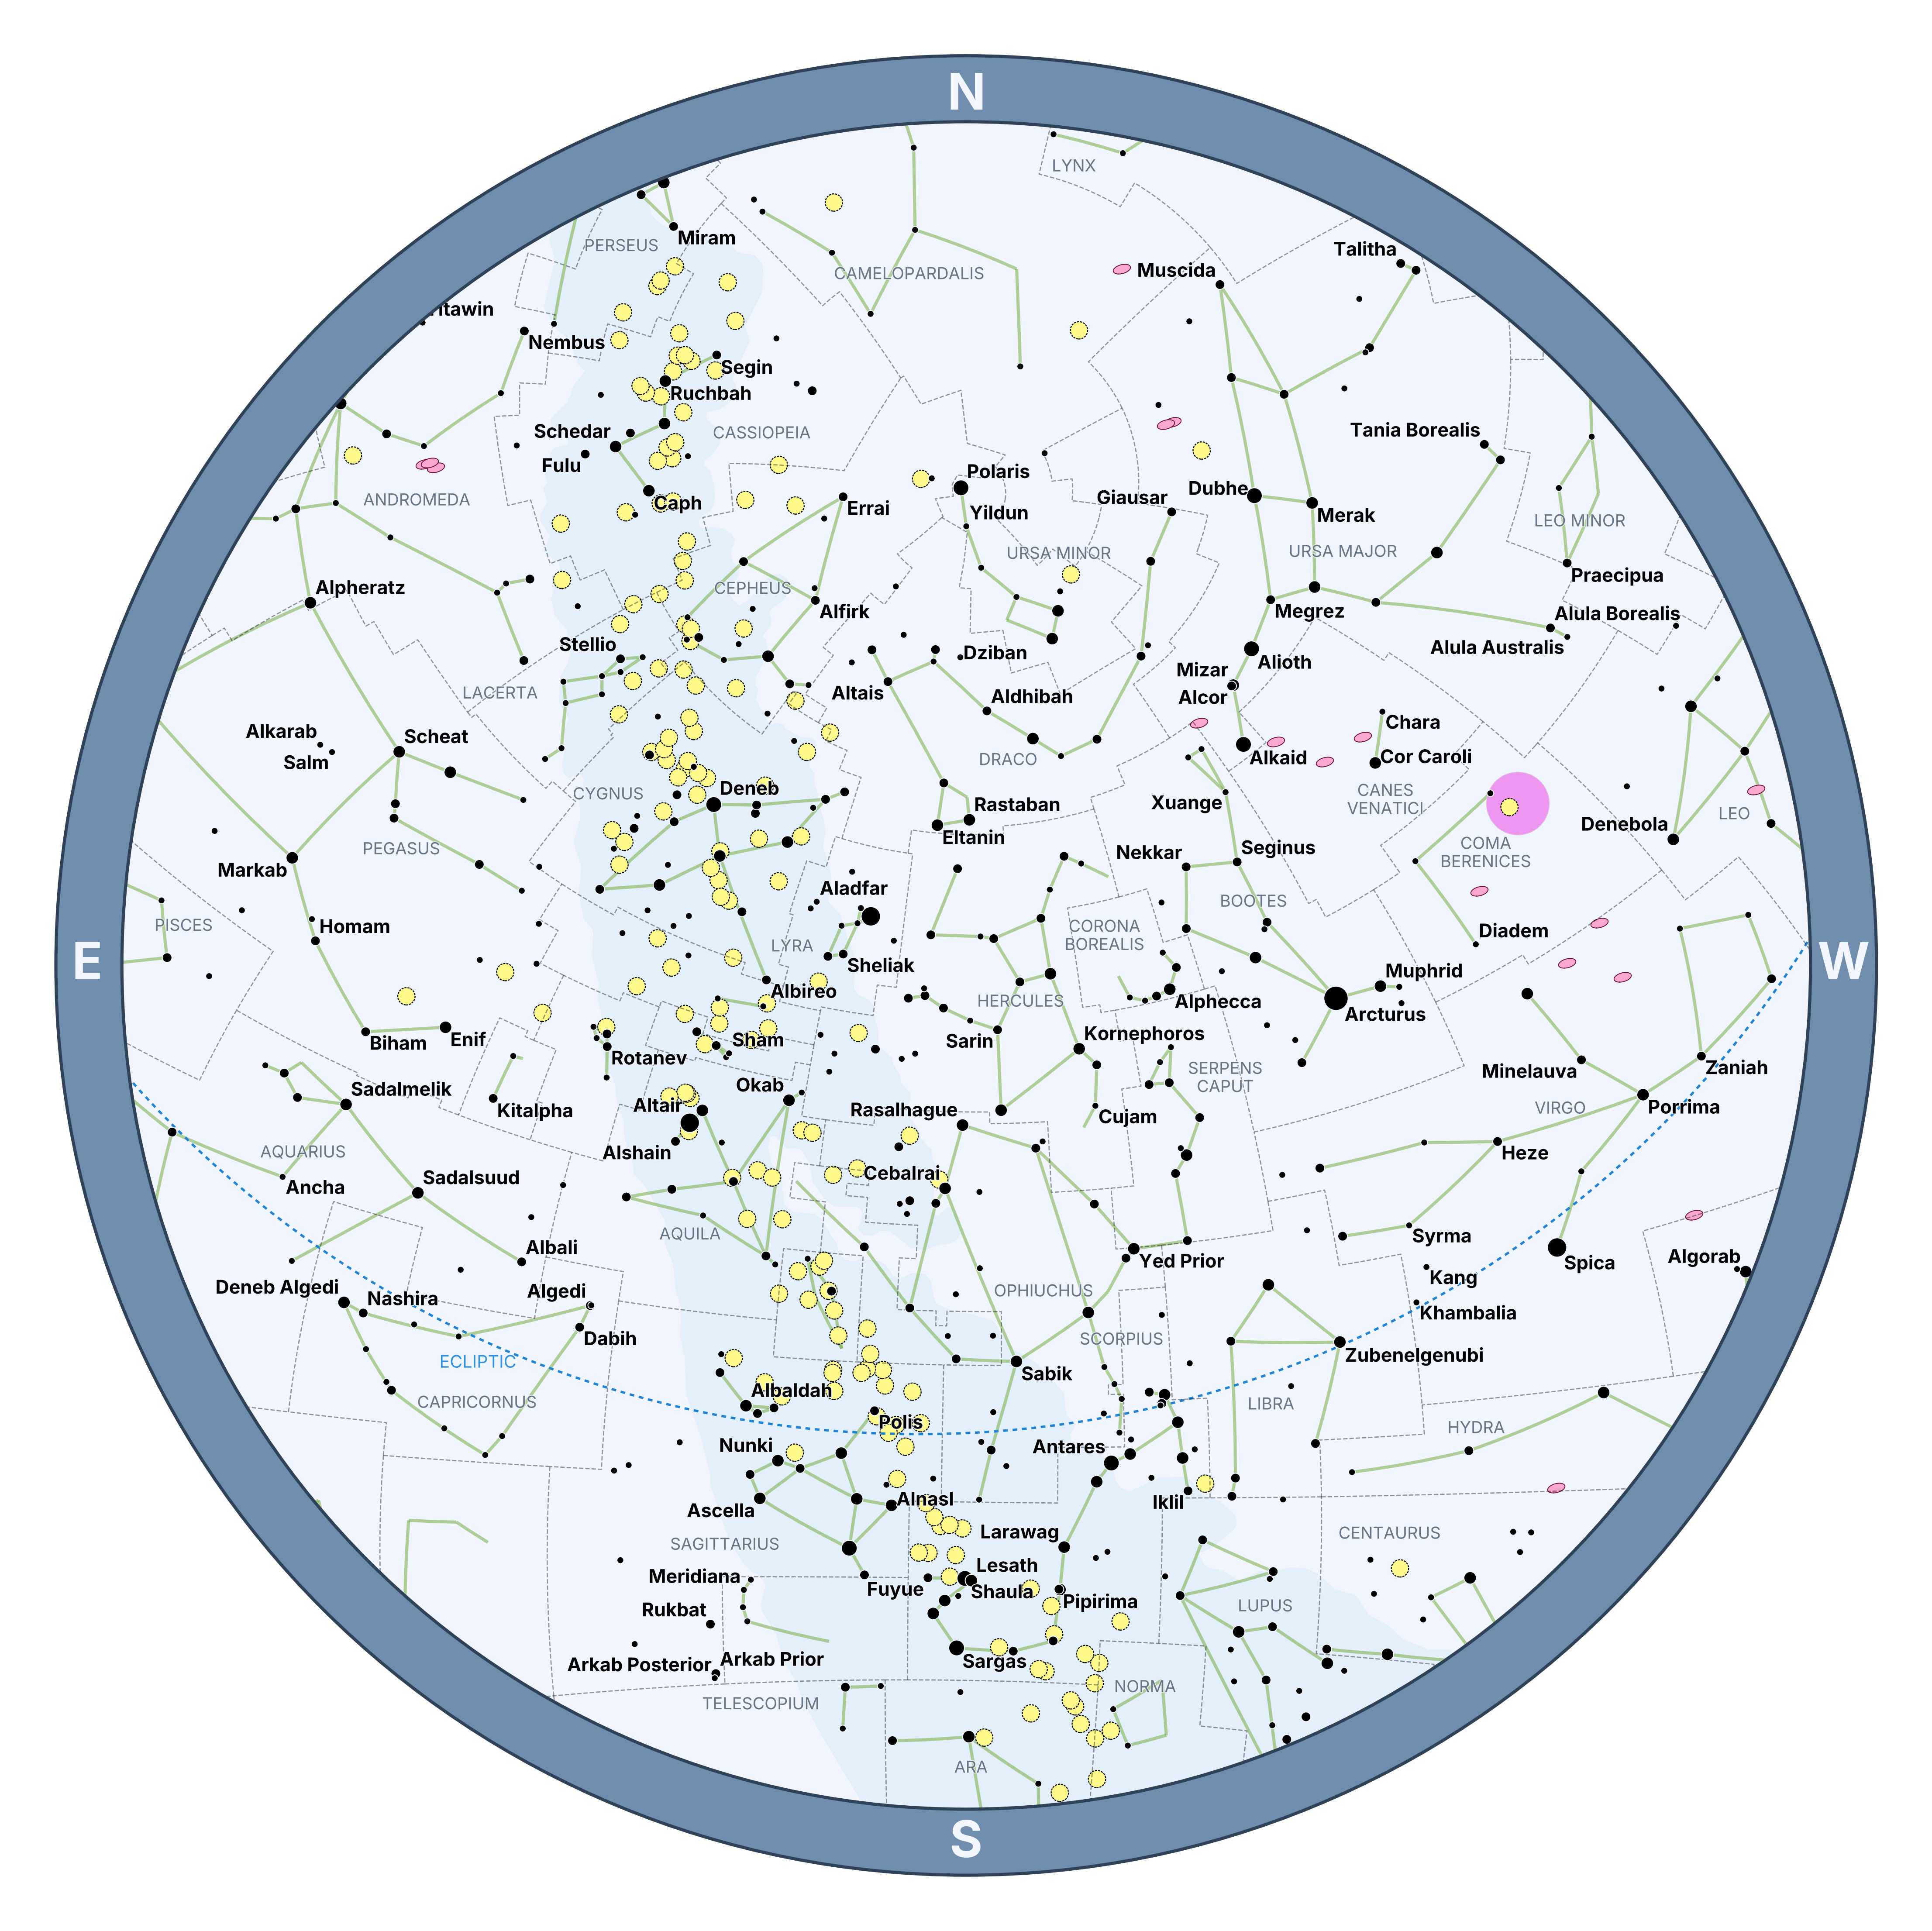
Building on the first example, let's add some color and more objects to the plot, to create the chart above. Here's the revised code with comments explaining the new lines:

from datetime import datetime
from pytz import timezone
from starplot import MapPlot, Projection
from starplot.styles import PlotStyle, extensions


tz = timezone("America/Los_Angeles")
dt = datetime(2023, 7, 13, 22, 0, tzinfo=tz)  # July 13, 2023 at 10pm PT

p = MapPlot(
    projection=Projection.ZENITH,
    lat=33.363484,
    lon=-116.836394,
    dt=dt,
    # add a style to the plot
    style=PlotStyle().extend(
        extensions.BLUE_MEDIUM,
    ),
    resolution=3600,
)
p.constellations()
p.stars(mag=4.6)

# plot galaxies and open clusters with a limiting magnitude of 9
# and do NOT plot their true apparent size
p.galaxies(mag=9, true_size=False, labels=None)
p.open_clusters(mag=9, true_size=False, labels=None)

# plot constellation borders, the ecliptic, and celestial equator
p.constellation_borders()
p.ecliptic()
p.celestial_equator()

# plot the Milky Way
p.milky_way()

# plot a marker for the Coma Star Cluster (aka Melotte 111) and customize its style.
# Starplot also has functions for plotting circles, rectangles, polygons, and more.
# See the reference for MapPlot for details.
p.marker(
    ra=12.36,
    dec=25.85,
    label="Mel 111",
    style={
        "marker": {
            "size": 28,
            "symbol": "circle",
            "fill": "full",
            "color": "#ed7eed",
            "edge_color": "#e0c1e0",
            "alpha": 0.4,
        },
        "label": {
            "font_size": 12,
            "font_weight": "bold",
            "font_color": "#c83cc8",
            "font_alpha": 0.8,
        },
    },
)
p.horizon()

p.export("tutorial_03.png", transparent=True)

Here are some more details about what we changed:

  • Customized the style by adding the style keyword argument when creating the plot instance. This is an instance of a PlotStyle, and it represents ALL the styling properties to use for the plot (e.g. the colors, symbols, sizes, and more). In our revised example here, we create a default PlotStyle and then extend it with the BLUE_MEDIUM color scheme. Starplot has a very customizable styling framework that allows you to customize the appearance of just about anything you plot.

  • Plotted deep sky objects (DSOs) with a limiting magnitude of 9. The true_size=False argument tells Starplot to plot each DSO's size based on what's specified in the style definition and NOT their true apparent size. For zenith plots like this one, plotting the true size can make many DSOs too small to see on the plot. We also pass labels=None to hide all the labels for DSOs to avoid cluttering the plot.

  • Plotted other lines and objects: constellation borders, ecliptic, celestial equator, and the Milky Way.

  • Added a marker for the Coma Star Cluster (aka Melotte 111), and customized its style. Starplot also has functions for plotting circles, rectangles, polygons, and more. See the reference for MapPlot for details.

In the next section, we'll learn how to create maps in other projections...