The zenith plot is known as a perspective projection, which means it depends on a time and place. They're useful for many things in astronomy, but Starplot also lets you create general-purpose maps of the sky that are independent of location.
To create a general map, you use the MapPlot class, which works similar to the zenith plot but takes a few different parameters:
projection: Instance of a Projection, which is the method to use for transforming the curved shape of the three-dimensional sky to a flat two-dimensional map. In this example, we use a Mercator projection, but Starplot supports many types of projections and you can customize their properties (e.g. central RA/DEC).
ra_min / ra_max : Right ascension (RA) extent of the map (in degrees)
dec_min / dec_max : Declination (DEC) extent of the map (in degrees)
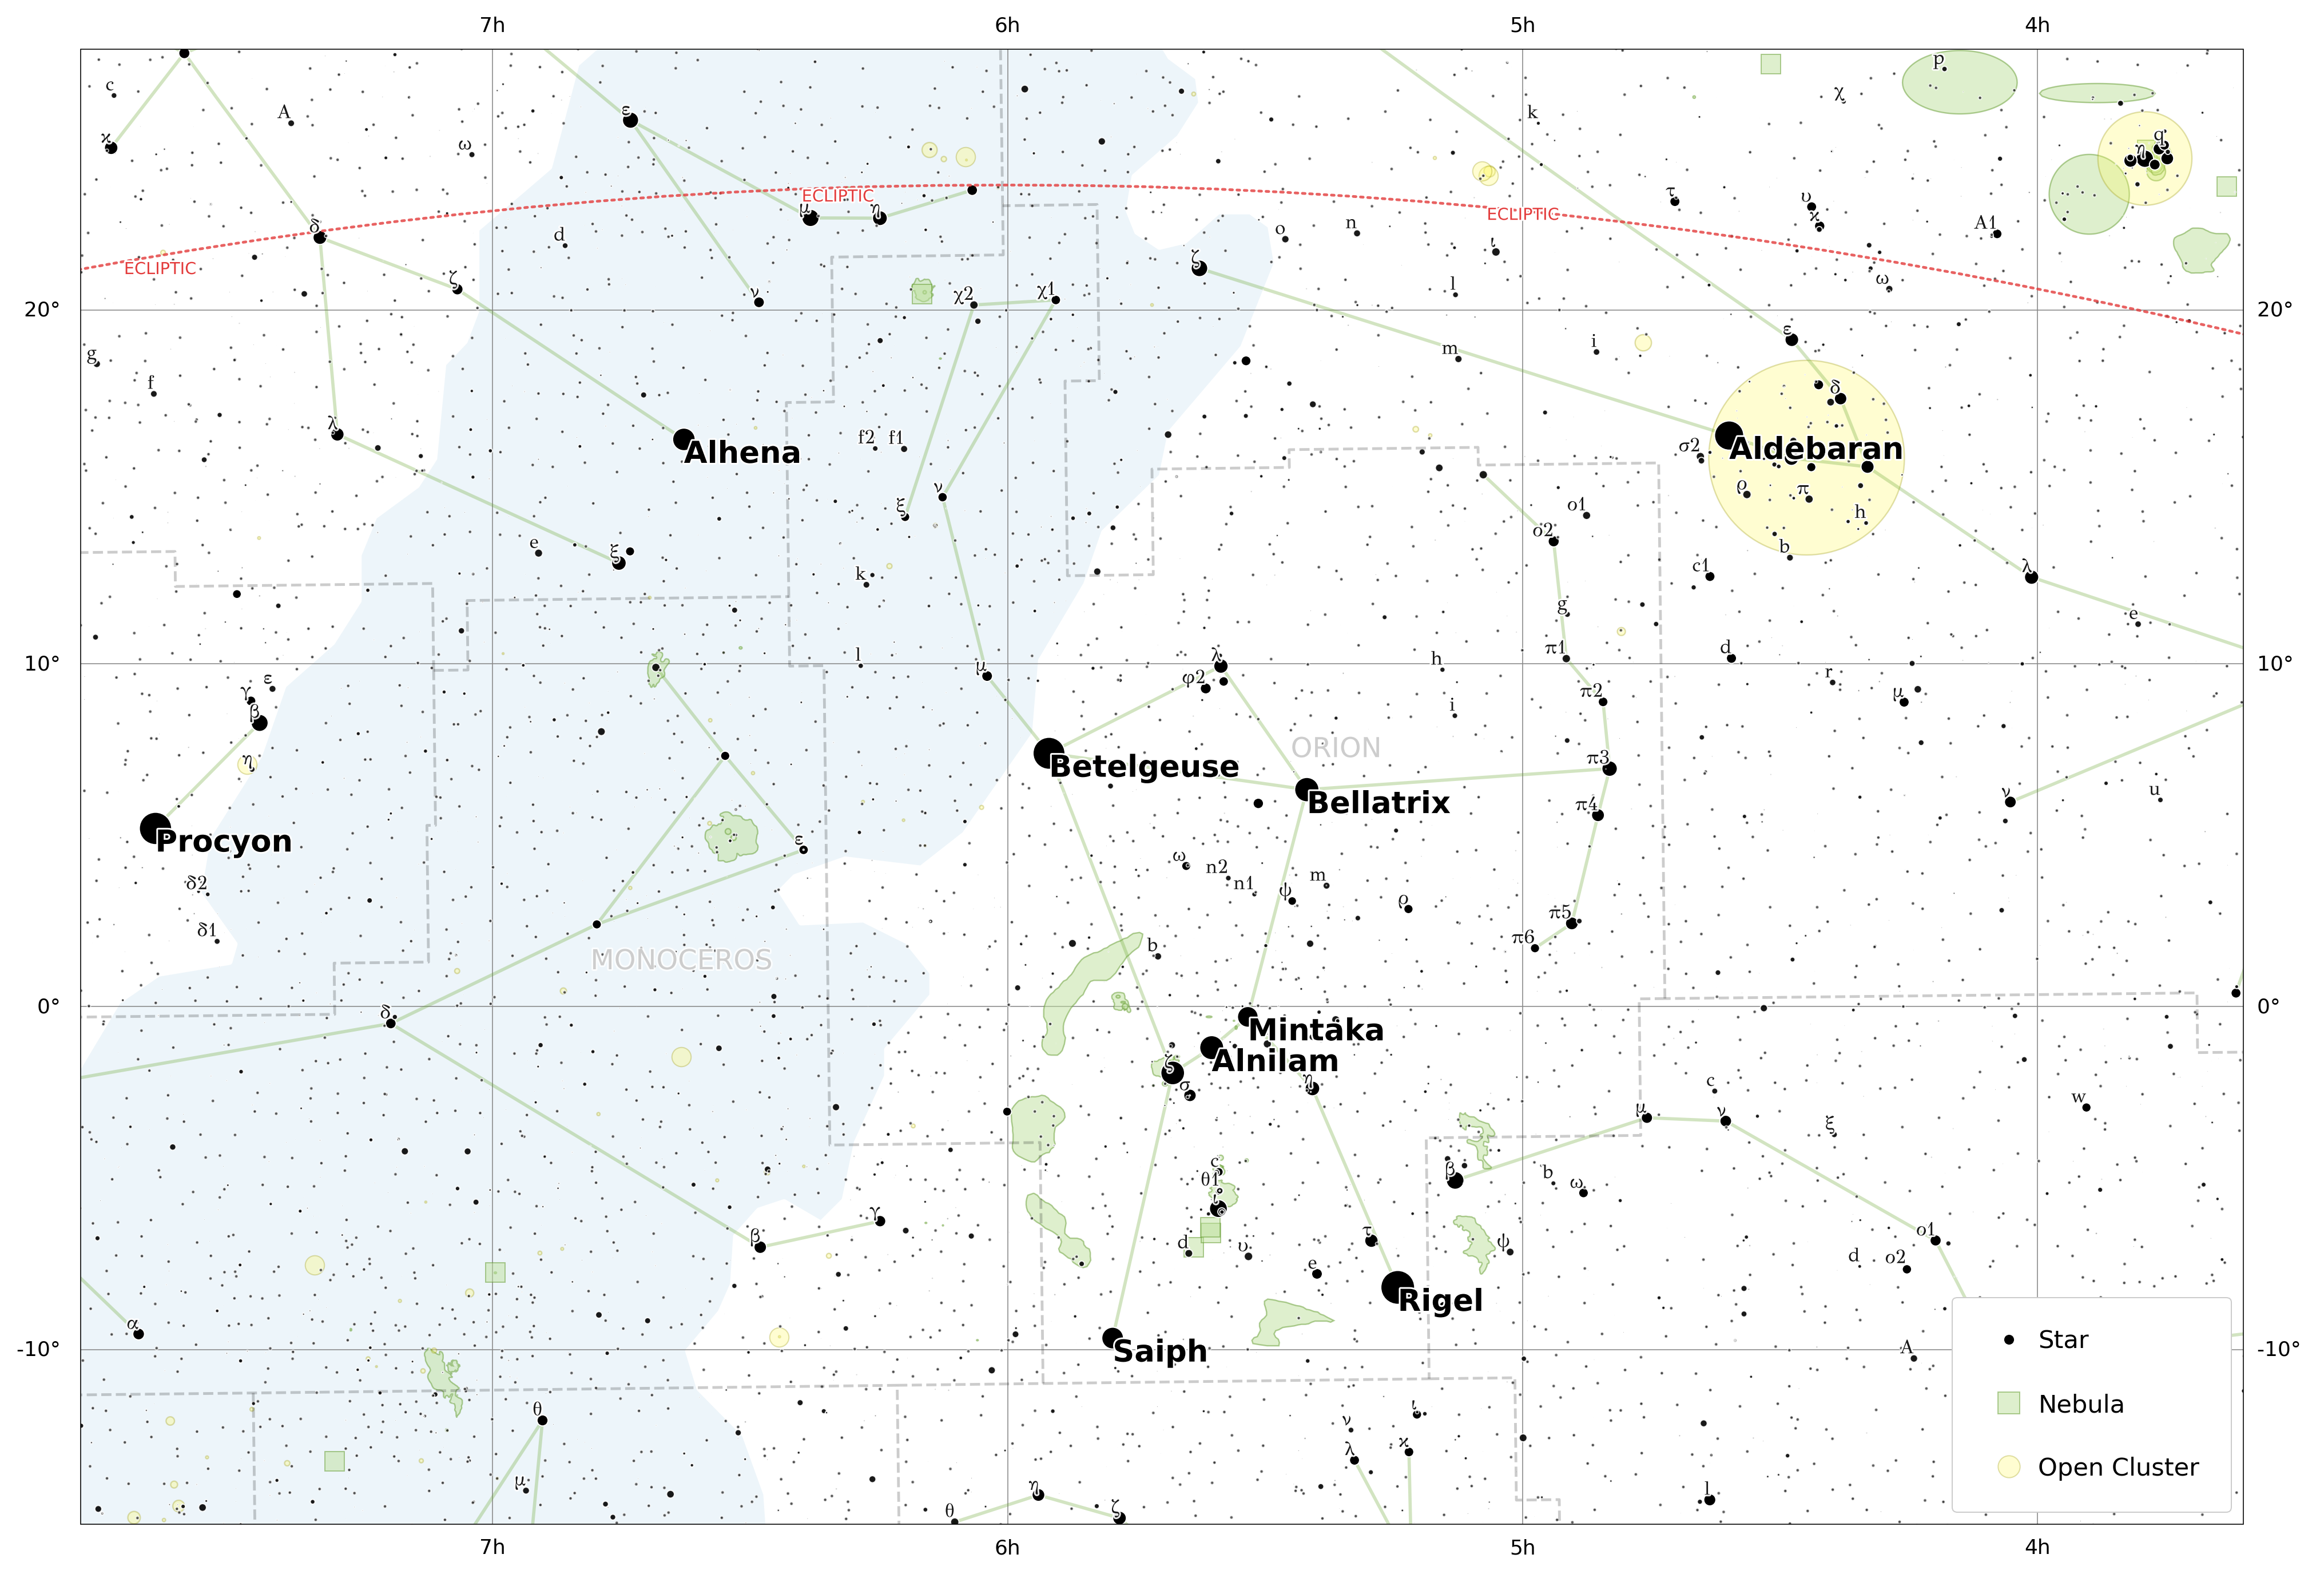
Here's a code example that creates a MapPlot of the area around Orion:
fromstarplotimportMapPlot,Mercator,_fromstarplot.stylesimportPlotStyle,extensionsstyle=PlotStyle().extend(extensions.BLUE_LIGHT,extensions.MAP,{"legend":{"location":"lower right",# show legend inside map"num_columns":3,"background_alpha":1,},},)p=MapPlot(projection=Mercator(),# specify a non-perspective projectionra_min=3.6*15,# limit the map to a specific areara_max=7.8*15,dec_min=-15,dec_max=27,style=style,resolution=3600,autoscale=True,# automatically adjust the scale based on the resolution)p.gridlines()# add gridlinesp.constellations()p.constellation_borders()p.stars(where=[_.magnitude<8],where_labels=[_.magnitude<3],bayer_labels=True,flamsteed_labels=True,)# include Bayer and Flamsteed labels with the starsp.nebula(where=[(_.magnitude<9)|(_.magnitude.isnull())],where_labels=[False])p.open_clusters(where=[(_.magnitude<9)|(_.magnitude.isnull())],where_labels=[False])p.milky_way()p.ecliptic()p.legend()# add a legendp.constellation_labels()# Plot the constellation labels last for best placementp.export("tutorial_04.png",padding=0.2,transparent=True)
In the next section, we'll learn how to create an optic plot which shows an area of the sky when viewed through an optic (such as binoculars or a telescope)...