5 - Creating a Basic Optic Plot
Starplot also has optic plots, which simulate what you'll see through an optic (e.g. binoculars, telescope, camera) at a specific time and location. The simulated view will show you the true field of view for the optic, and it will even orient the stars based on the location you specify and the most logical position of your optic.
Optic plots work very similar to map plots, with a few key differences: they always require an observer, and they also require an optic.
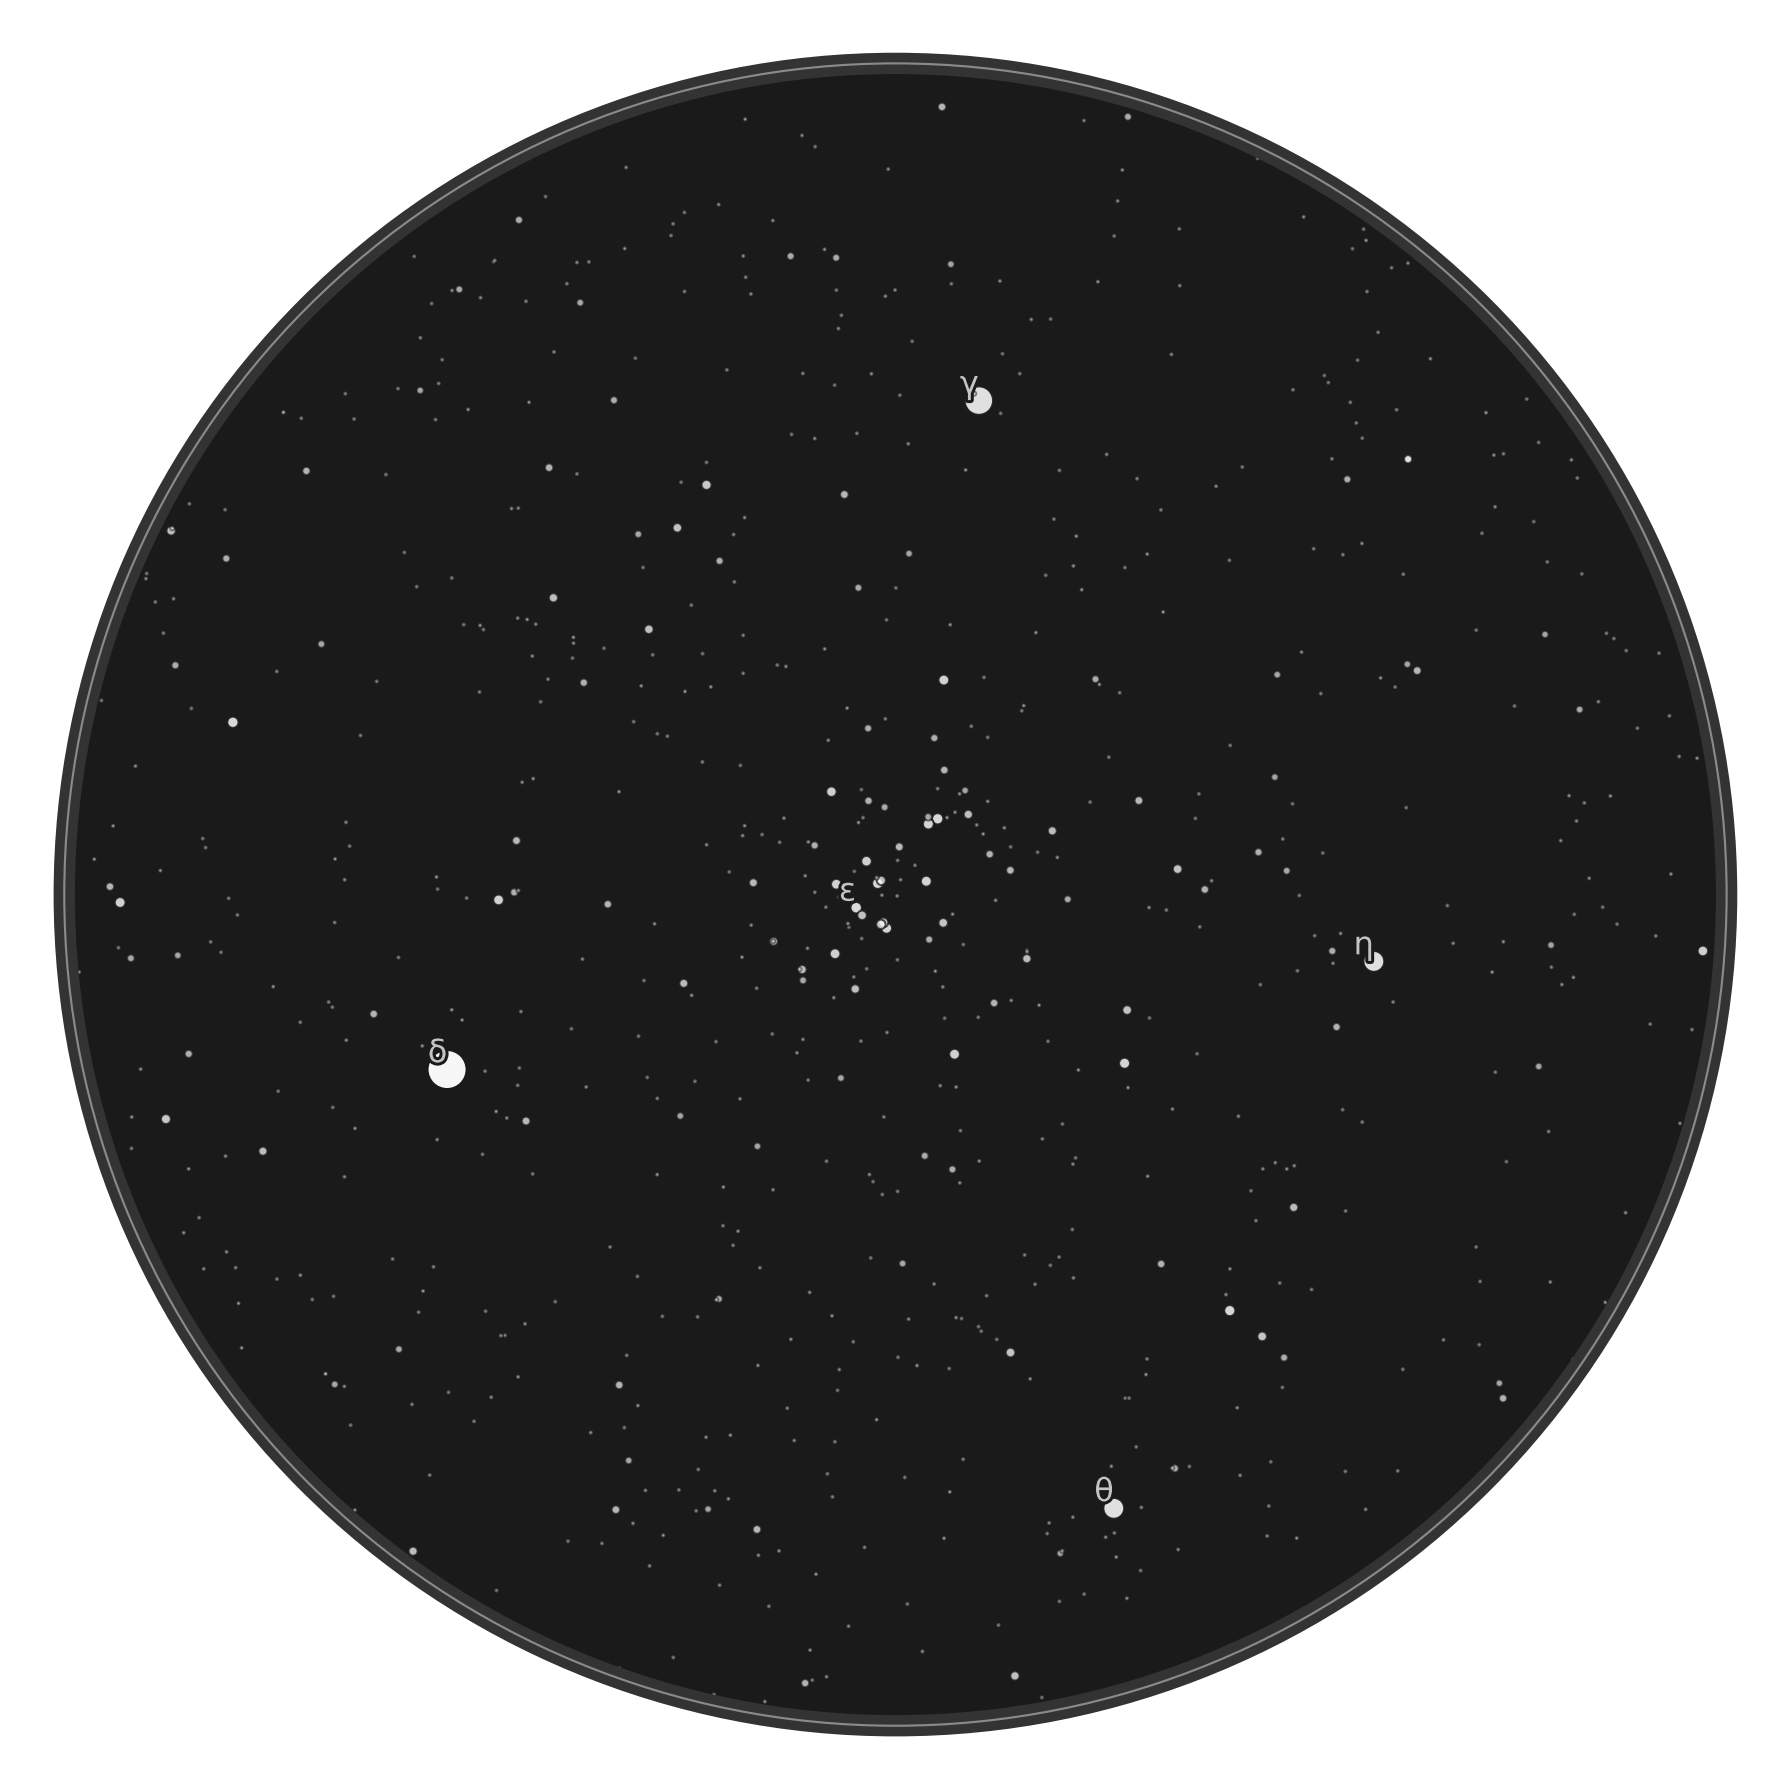
For example, here's how you'd create an optic plot of the The Pleiades (M45), viewed through 10x binoculars at 9pm PT on April 8, 2024 from Palomar Mountain:
The first 20 lines should look familiar from the other plots we've created in this tutorial.
On line 22, we use a powerful feature of Starplot: looking up an object and then using that object's properties to help us create the plot. In this example, we look up The Pleiades open cluster by calling the get function on the DSO model. This function returns an instance of the DSO model, which has various properties of the object, including it's position (RA/Dec).
On line 24, we create the OpticPlot, using properties from the m45 model we just retrieved. Most of the kwargs should look familiar, except for the following:
ra: Right ascension of the targetdec: Declination of the targetoptic: An instance of an optic. This example uses binoculars, but Starplot also supports refractor/reflector telescopes, generic scopes, and cameras.
The ra/dec you specify for the target will be the center of the plot.
In the next section, we'll learn how to be more selective of objects to plot...