When plotting stars, constellations, or deep sky objects (DSOs), you may want to limit the plotted objects by more than just a limiting magnitude. Starplot provides a way to filter objects by using expressions. This allows you to be very specific about which objects to plot, and it also gives you a way to style objects differently (e.g. if you want to style very bright stars differently than dim stars).
To select objects to plot, you pass a list of expressions using the where keyword argument. For example, here's how you'd plot all stars that have a magnitude less than 6 and a B-V index of more than 0.4:
p.stars(where=[_.magnitude<6,_.bv>0.4,],)
When passing the where kwarg, only the objects that satisfy ALL the where conditions will be plotted. You can reference any field on the model in expressions, and there are also a few functions available for determining if a field is null or is in a list of values. For complete details about selecting objects, see the reference page.
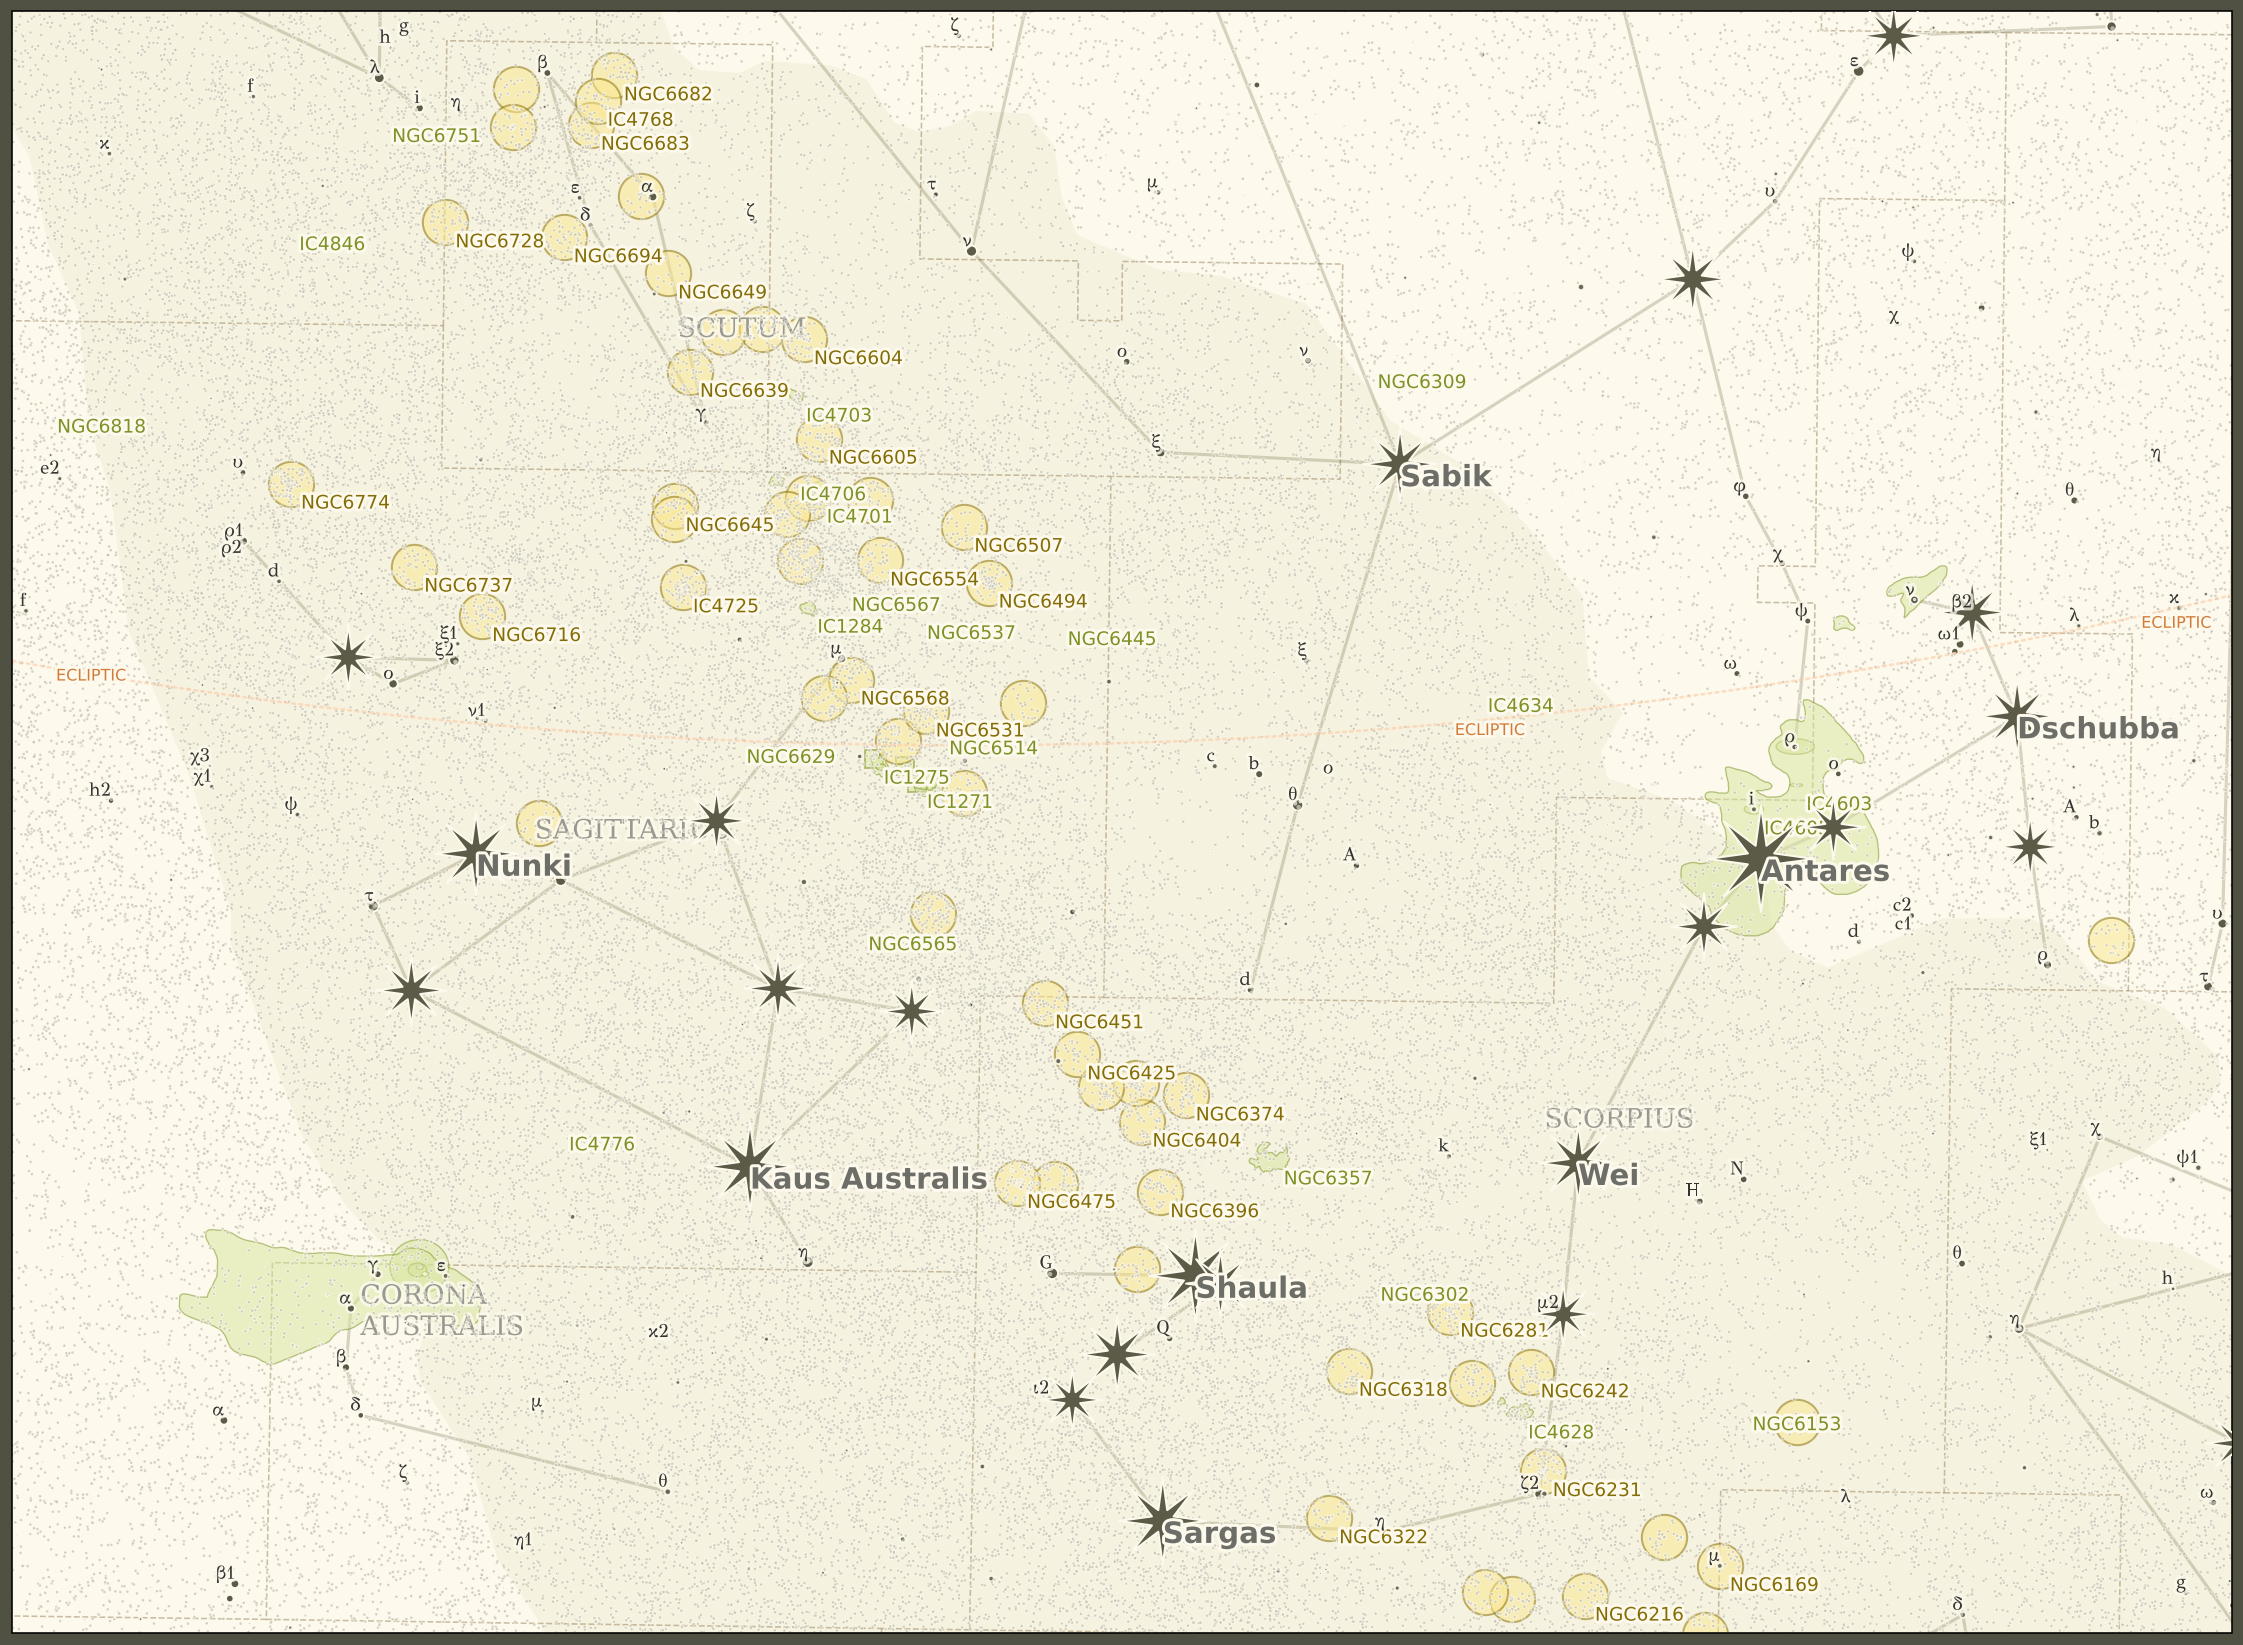
Here's some code that uses the where kwarg extensively to produce the image above:
fromstarplotimportMapPlot,Miller,callables,_fromstarplot.stylesimportPlotStyle,extensionsstyle=PlotStyle().extend(extensions.BLUE_NIGHT,extensions.MAP,)p=MapPlot(projection=Miller(),ra_min=15*15,ra_max=20*15,dec_min=-45.2,dec_max=-3,style=style,resolution=3600,scale=0.8,)p.constellations()p.constellation_borders()p.stars(# select the brightest stars:where=[_.magnitude<=3],# here we make the stars 2x bigger by passing in a custom size function (i.e. a callable)# you'll learn more about this later in the tutorial...size_fn=lambdad:callables.size_by_magnitude(d)*2,# use an 8-pointed star for bright star markers:style__marker__symbol="star_8",style__label__offset_x=8,style__label__offset_y=-8,style__label__border_width=2,)p.stars(where=[_.magnitude>3,# select the dimmer stars_.magnitude<8,],bayer_labels=True,)p.nebula(# select nebulae which have no defined magnitude or less than 7where=[_.magnitude.isnull()|(_.magnitude<7)],where_true_size=[_.size>1],# only plot large nebula as their true size)p.open_clusters(where=[_.magnitude.isnull()|(_.magnitude<7)],where_true_size=[False],)p.globular_clusters(where=[_.magnitude.isnull()|(_.magnitude<7)],where_true_size=[False],)p.ecliptic()p.milky_way()p.constellation_labels()p.export("tutorial_06.png",padding=0.08)
In the next section, we'll learn how to lookup objects to create plots...