Finding the Double Cluster in Perseus
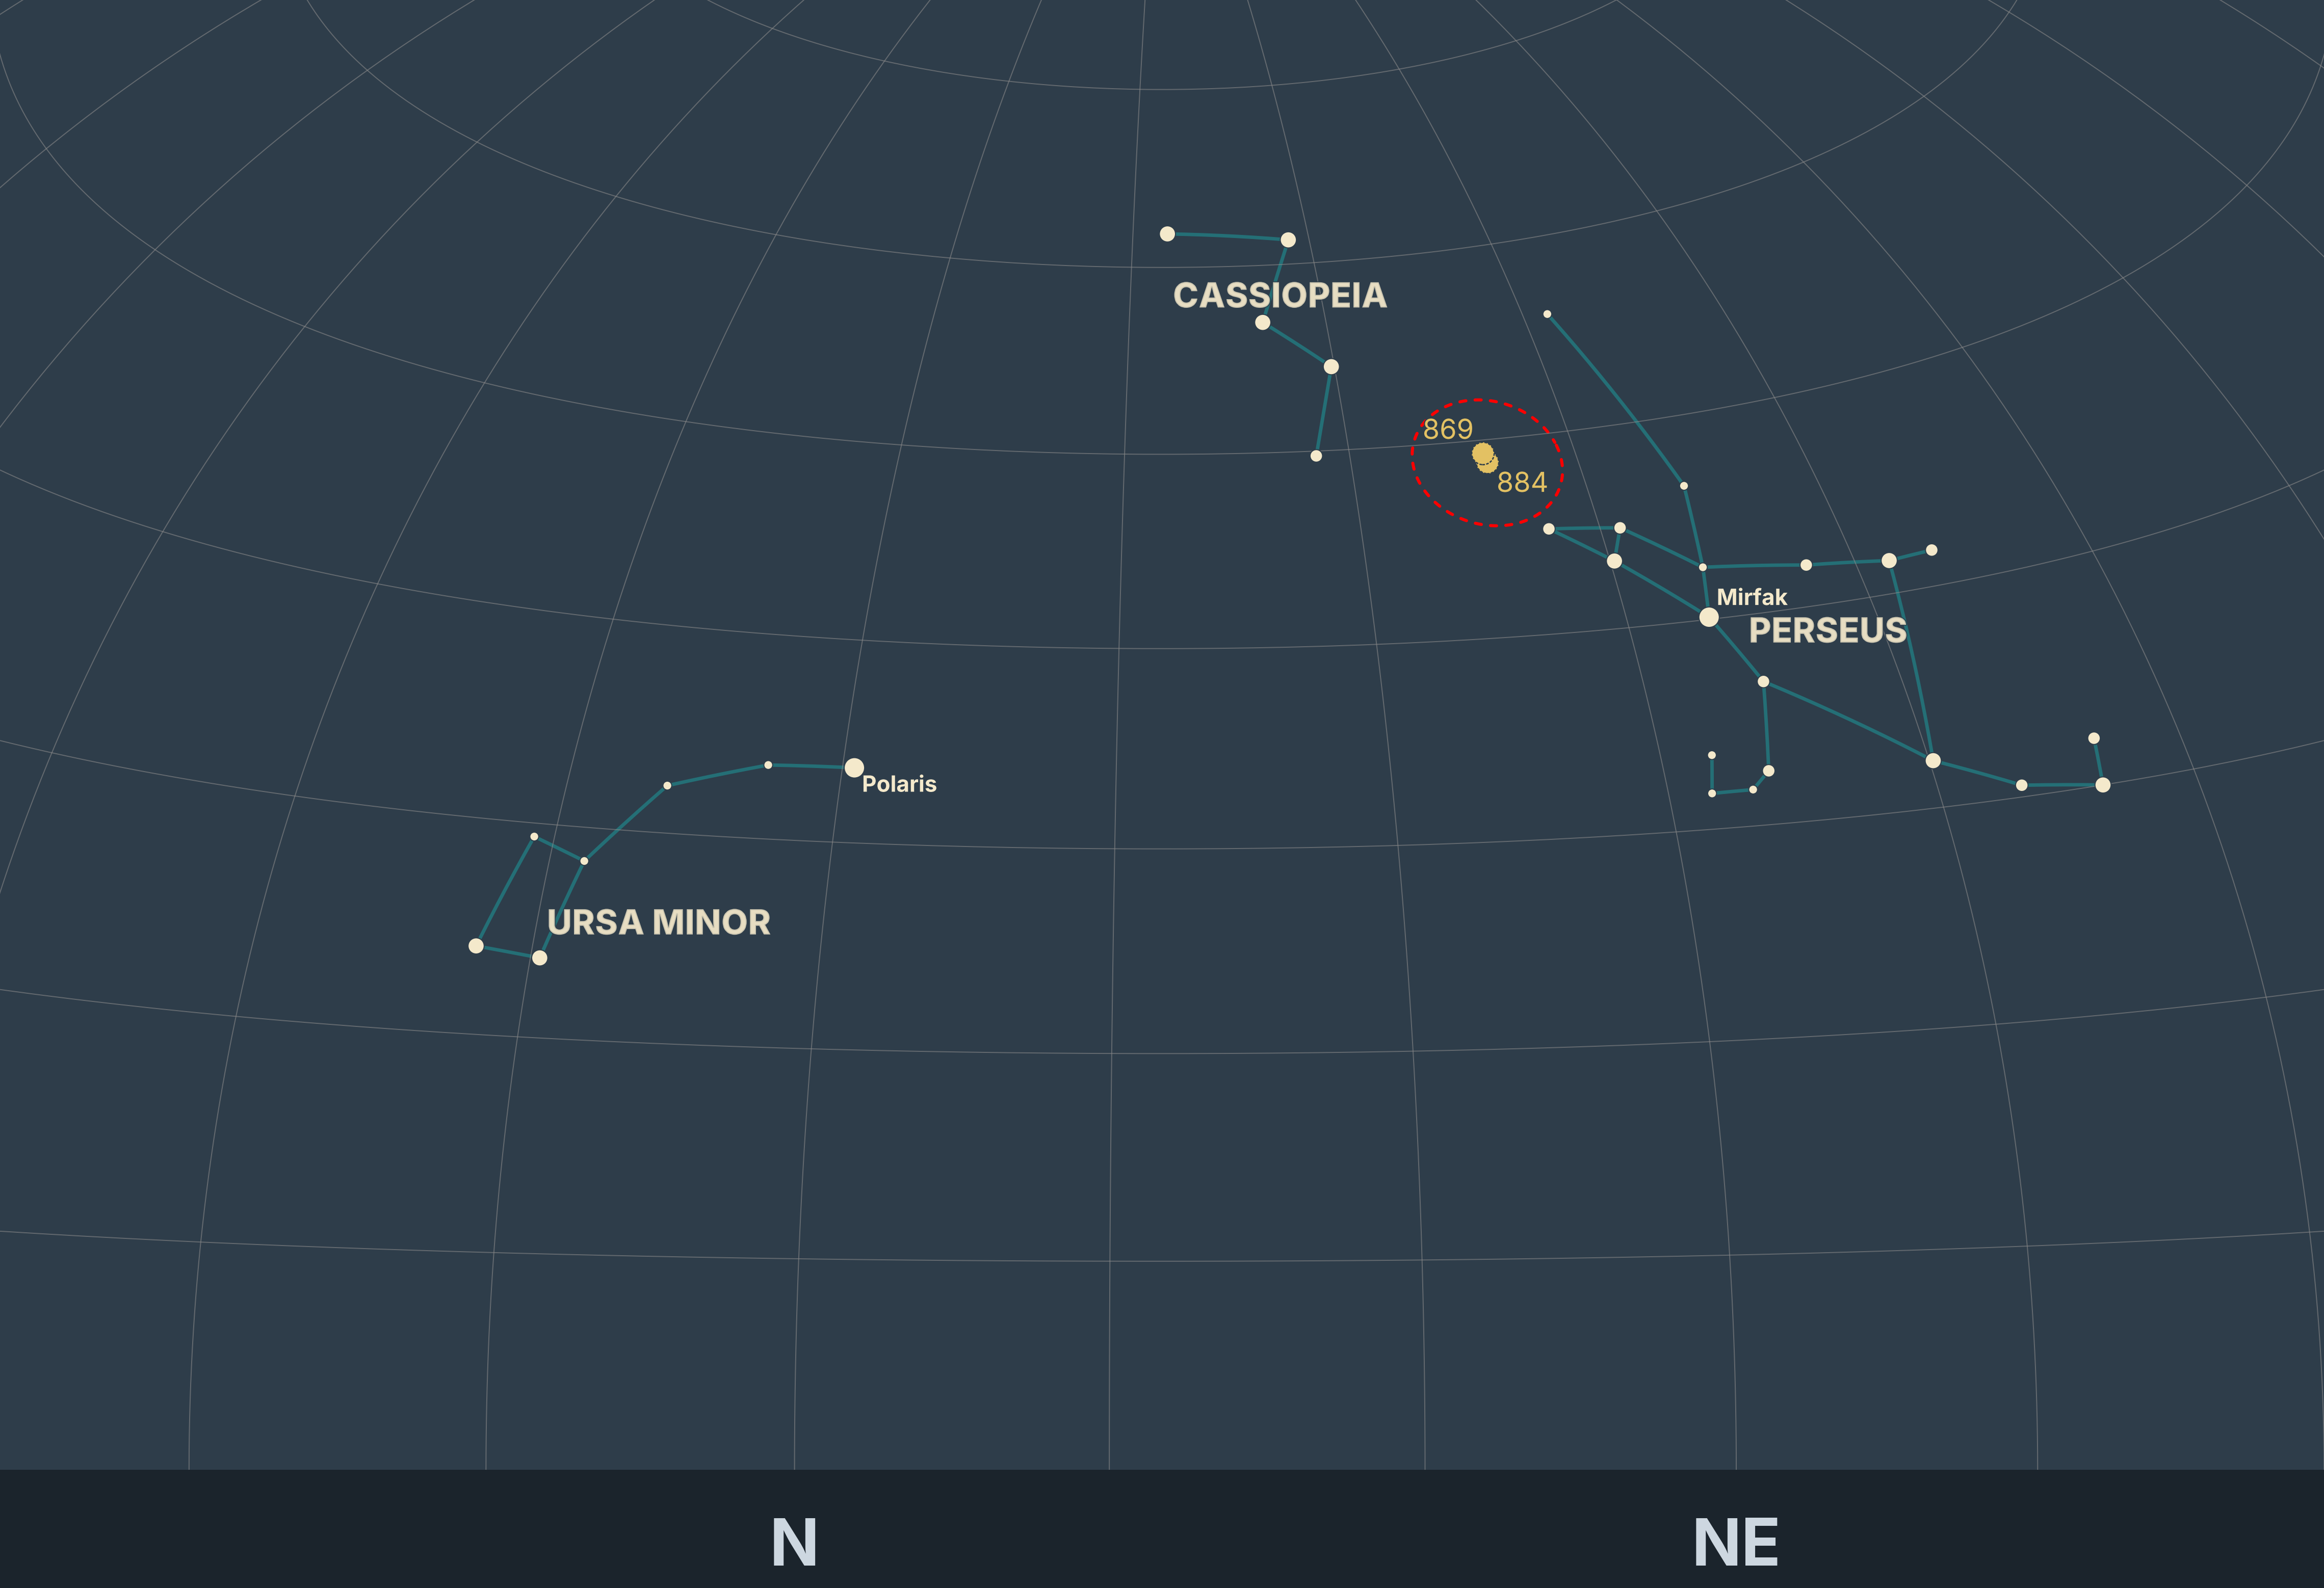
Here's a chart you might create to help you find the Double Cluster (NGC 884 and 869) in Perseus and to visualize the field of view with 10x binoculars (the red dashed circle).
This example uses many of Starplot's features:
- Looking up objects
- Using properties on those objects to selectively plot stars (in this example, we use the constellation models to only plot stars that are part of the lines in the constellation)
- Drawing a circle to show the field of view for bincoulars
- Drawing an arrow to show which stars you can use as guides to finding the double cluster
from datetime import datetime
from zoneinfo import ZoneInfo

from starplot import (
    HorizonPlot,
    PlotStyle,
    style_extensions,
    DSO,
    Star,
    Constellation,
    Observer,
    _,
    Binoculars,
)

style = PlotStyle().extend(
    style_extensions.BLUE_NIGHT,
    style_extensions.MAP,
    style_extensions.GRADIENT_ASTRONOMICAL_TWILIGHT,
)

tz = ZoneInfo("US/Pacific")
dt = datetime(2024, 11, 2, 21, 0, 0, 0, tzinfo=tz)

observer = Observer(
    dt=dt,
    lat=33.363484,
    lon=-116.836394,
)

cas = Constellation.get(iau_id="cas")
umi = Constellation.get(iau_id="umi")
per = Constellation.get(iau_id="per")

p = HorizonPlot(
    altitude=(0, 70),
    azimuth=(325, 440),
    observer=observer,
    style=style,
    resolution=4096,
    scale=1.35,
)
p.constellations(where=[_.iau_id.isin(["cas", "umi", "per"])])
p.stars(
    where=[_.hip.isin(cas.star_hip_ids + umi.star_hip_ids + per.star_hip_ids)],
    where_labels=[_.magnitude < 2],
)
p.open_clusters(
    where=[_.name.isin(["NGC0884", "NGC0869"])],
    where_labels=[False],
    where_true_size=[False],
)
double_cluster = DSO.get(name="NGC0884")
p.optic_fov(
    ra=double_cluster.ra,
    dec=double_cluster.dec,
    optic=Binoculars(
        fov=65,
        magnification=10,
    ),
)

star1 = Star.get(hip=4427)
p.arrow(
    origin=(star1.ra, star1.dec),
    target=(double_cluster.ra, double_cluster.dec),
    scale=0.92,
    style__zorder=0,
    style__head_width=100,
)

p.horizon()
p.style.gridlines.line.width = 2
p.gridlines()

p.export("horizon_double_cluster.png", padding=0.25)