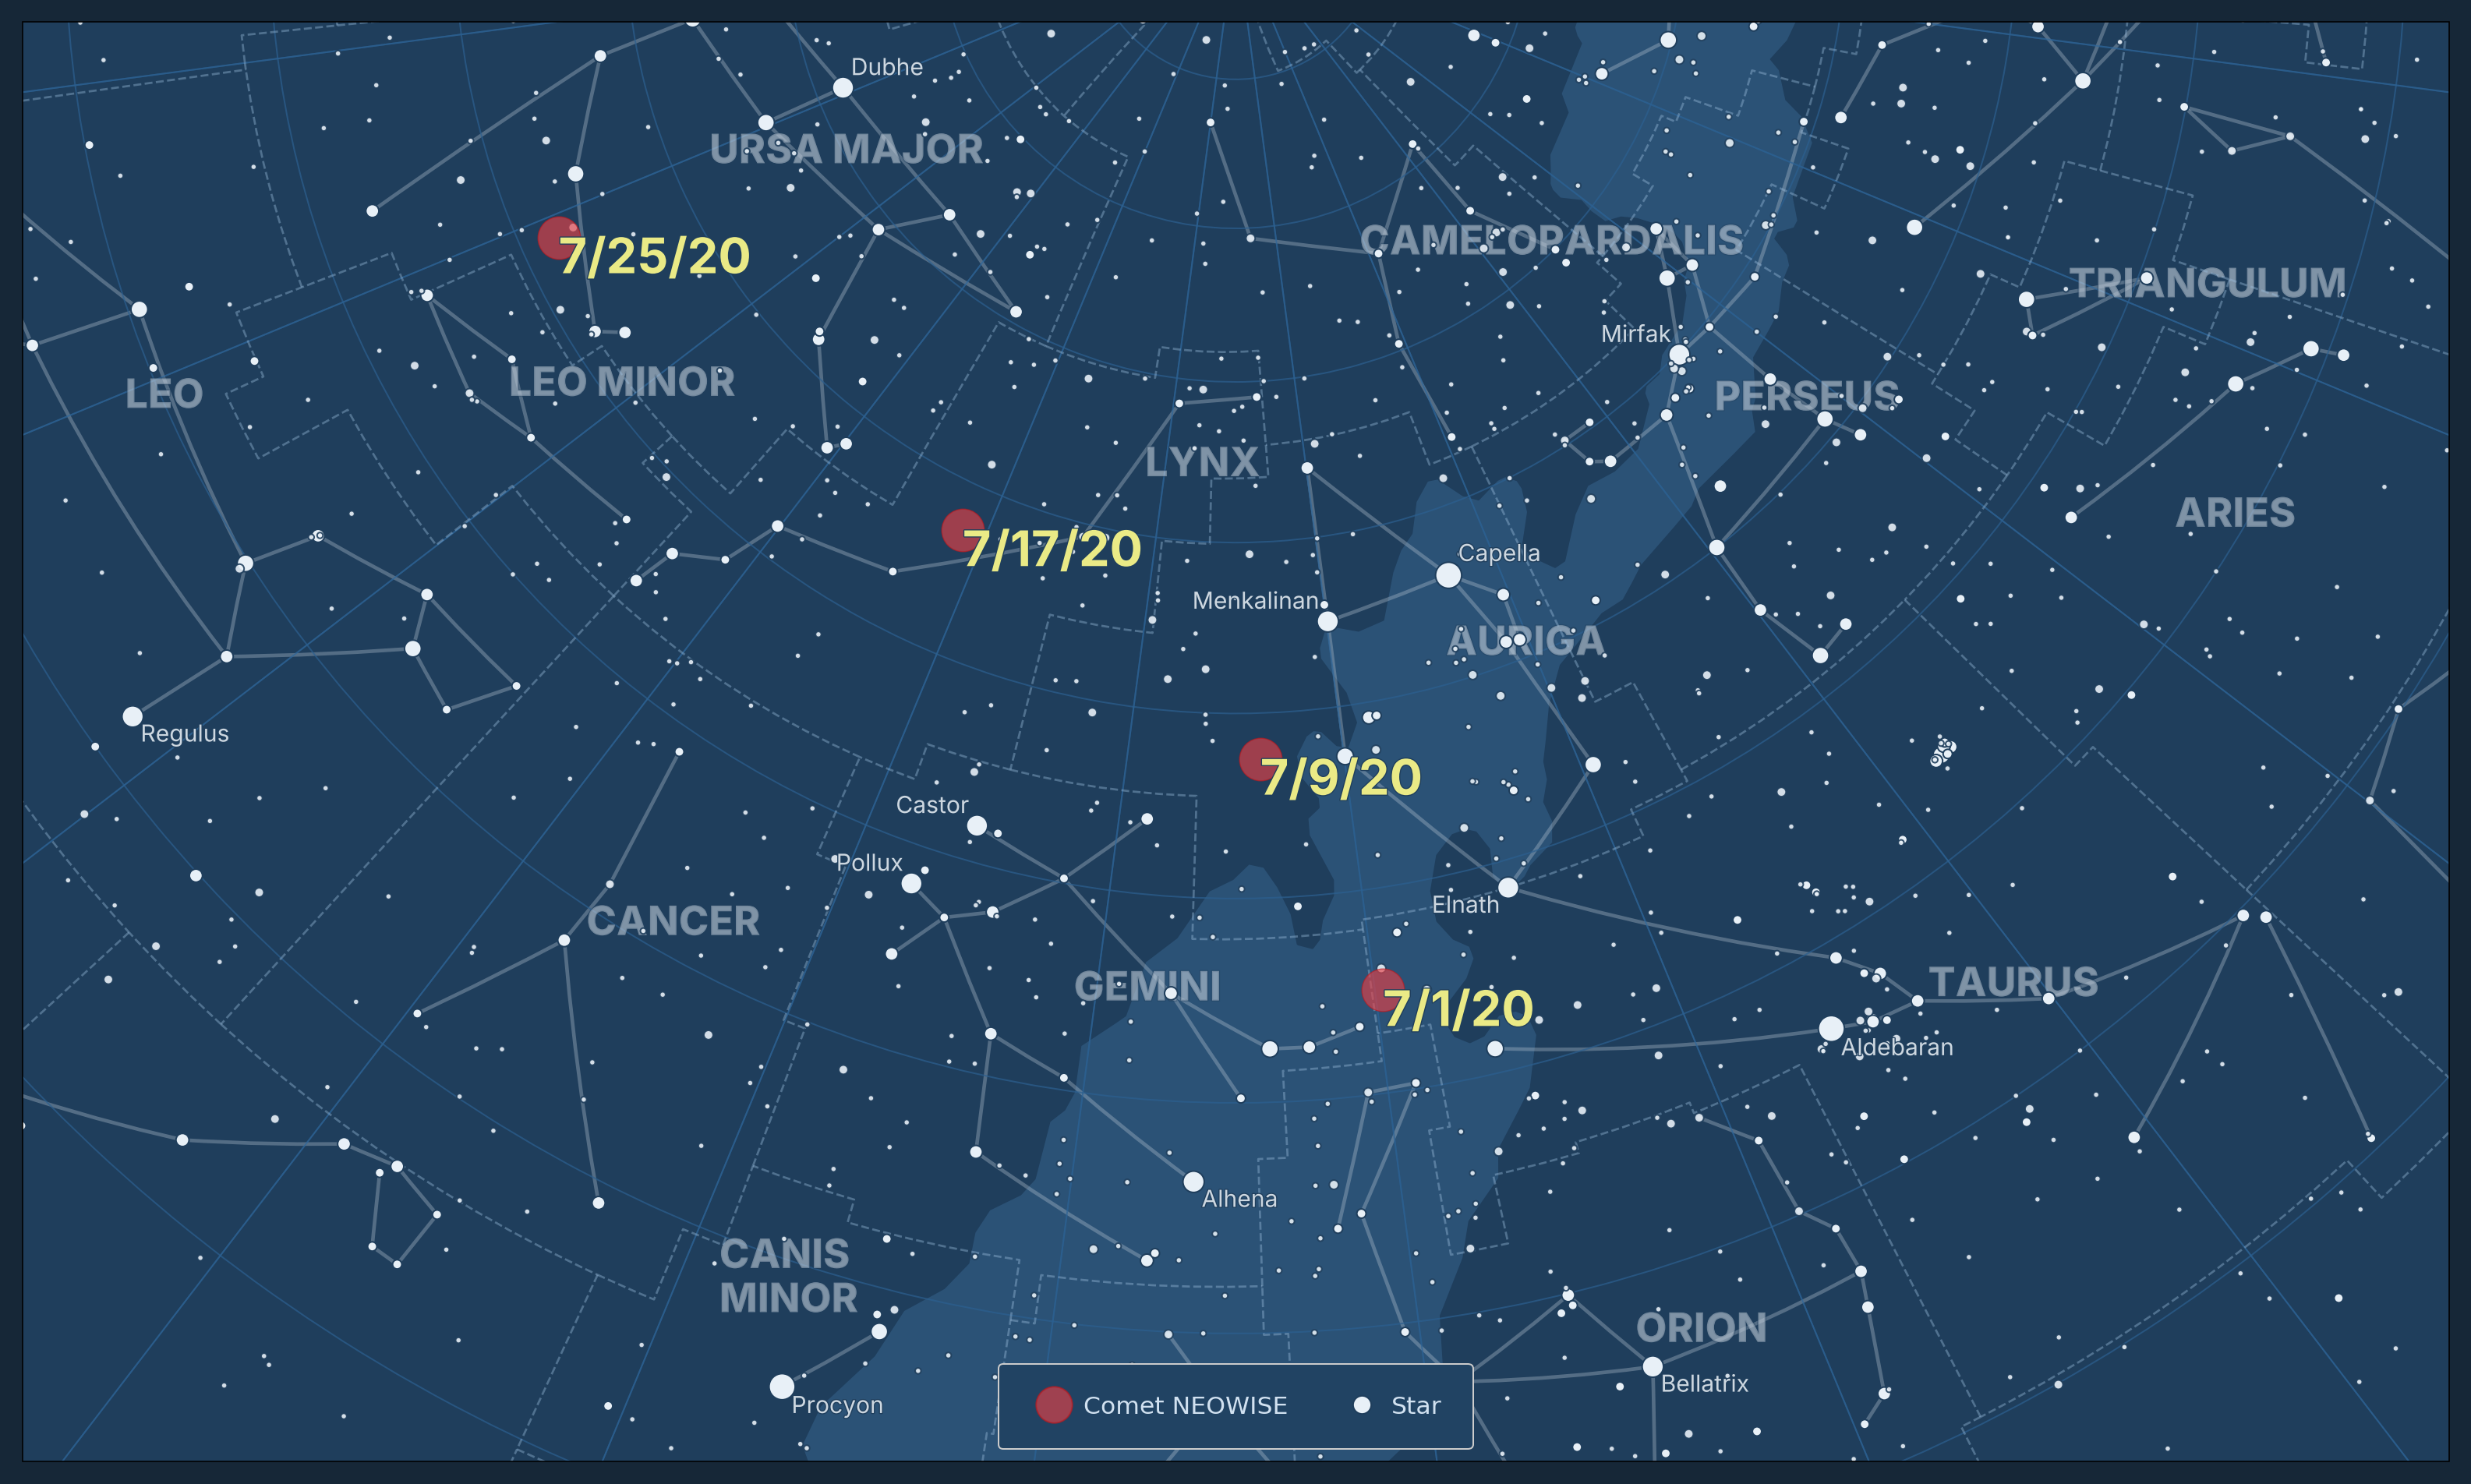
Map of Comet NEOWISE
Here's an example that uses Skyfield to get some data on the comet NEOWISE ☄️ and then uses that data to plot the comet's location in the sky in July 2020:
Note
Skyfield is a required dependency of Starplot (and a very important one!), so if you have Starplot installed, then Skyfield should be installed too.
from skyfield.api import load
from skyfield.data import mpc
from skyfield.constants import GM_SUN_Pitjeva_2005_km3_s2 as GM_SUN

from starplot import MapPlot, Projection, Star, _
from starplot.styles import PlotStyle, extensions

# First, we use Skyfield to get comet data
# Code adapted from: https://rhodesmill.org/skyfield/kepler-orbits.html#comets
with load.open(mpc.COMET_URL) as f:
    comets = mpc.load_comets_dataframe(f)

# Keep only the most recent orbit for each comet,
# and index by designation for fast lookup.
comets = (
    comets.sort_values("reference")
    .groupby("designation", as_index=False)
    .last()
    .set_index("designation", drop=False)
)

# Find Comet NEOWISE
row = comets.loc["C/2020 F3 (NEOWISE)"]

ts = load.timescale()
eph = load("de421.bsp")
sun, earth = eph["sun"], eph["earth"]
comet = sun + mpc.comet_orbit(row, ts, GM_SUN)

# Find the RA/DEC of comet for every 8 days starting on July 1, 2020
radecs = []
for day in range(0, 32, 8):
    t = ts.utc(2020, 7, 1 + day)
    ra, dec, distance = earth.at(t).observe(comet).radec()
    radecs.append((t, ra.hours * 15, dec.degrees))

# Now let's plot the data on a map!
style = PlotStyle().extend(
    extensions.BLUE_DARK,
    extensions.MAP,
    {
        "star": {
            "label": {
                "font_weight": "normal",
            }
        },
        "legend": {
            "location": "lower center",
        },
    },
)
style.legend.location = "lower center"

p = MapPlot(
    projection=Projection.STEREO_NORTH,
    ra_min=3 * 15,
    ra_max=10 * 15,
    dec_min=5,
    dec_max=80,
    style=style,
    resolution=3000,
    autoscale=True,
)

# Plot the comet markers first, to ensure their labels are plotted
for t, ra, dec in radecs:
    label = f"{t.utc.month}/{t.utc.day}/{t.utc.year % 100}"
    p.marker(
        ra=ra,
        dec=dec,
        style={
            "marker": {
                "size": 40,
                "symbol": "circle",
                "fill": "full",
                "color": "hsl(358, 78%, 58%)",
                "edge_color": "hsl(358, 78%, 42%)",
                "alpha": 0.64,
                "zorder": 4096,
            },
            "label": {
                "font_size": 46,
                "font_weight": "bold",
                "font_color": "hsl(60, 70%, 72%)",
                "zorder": 4096,
                "offset_x": "auto",
                "offset_y": "auto",
            },
        },
        label=label,
        legend_label="Comet NEOWISE",
    )

p.gridlines(labels=False)
p.constellations()
p.constellation_borders()
p.stars(where=[_.magnitude < 6], where_labels=[_.magnitude < 2])
p.constellation_labels()
p.milky_way()
p.legend()

p.export("map_comet_neowise.png", padding=0.2)
