Back to Examples
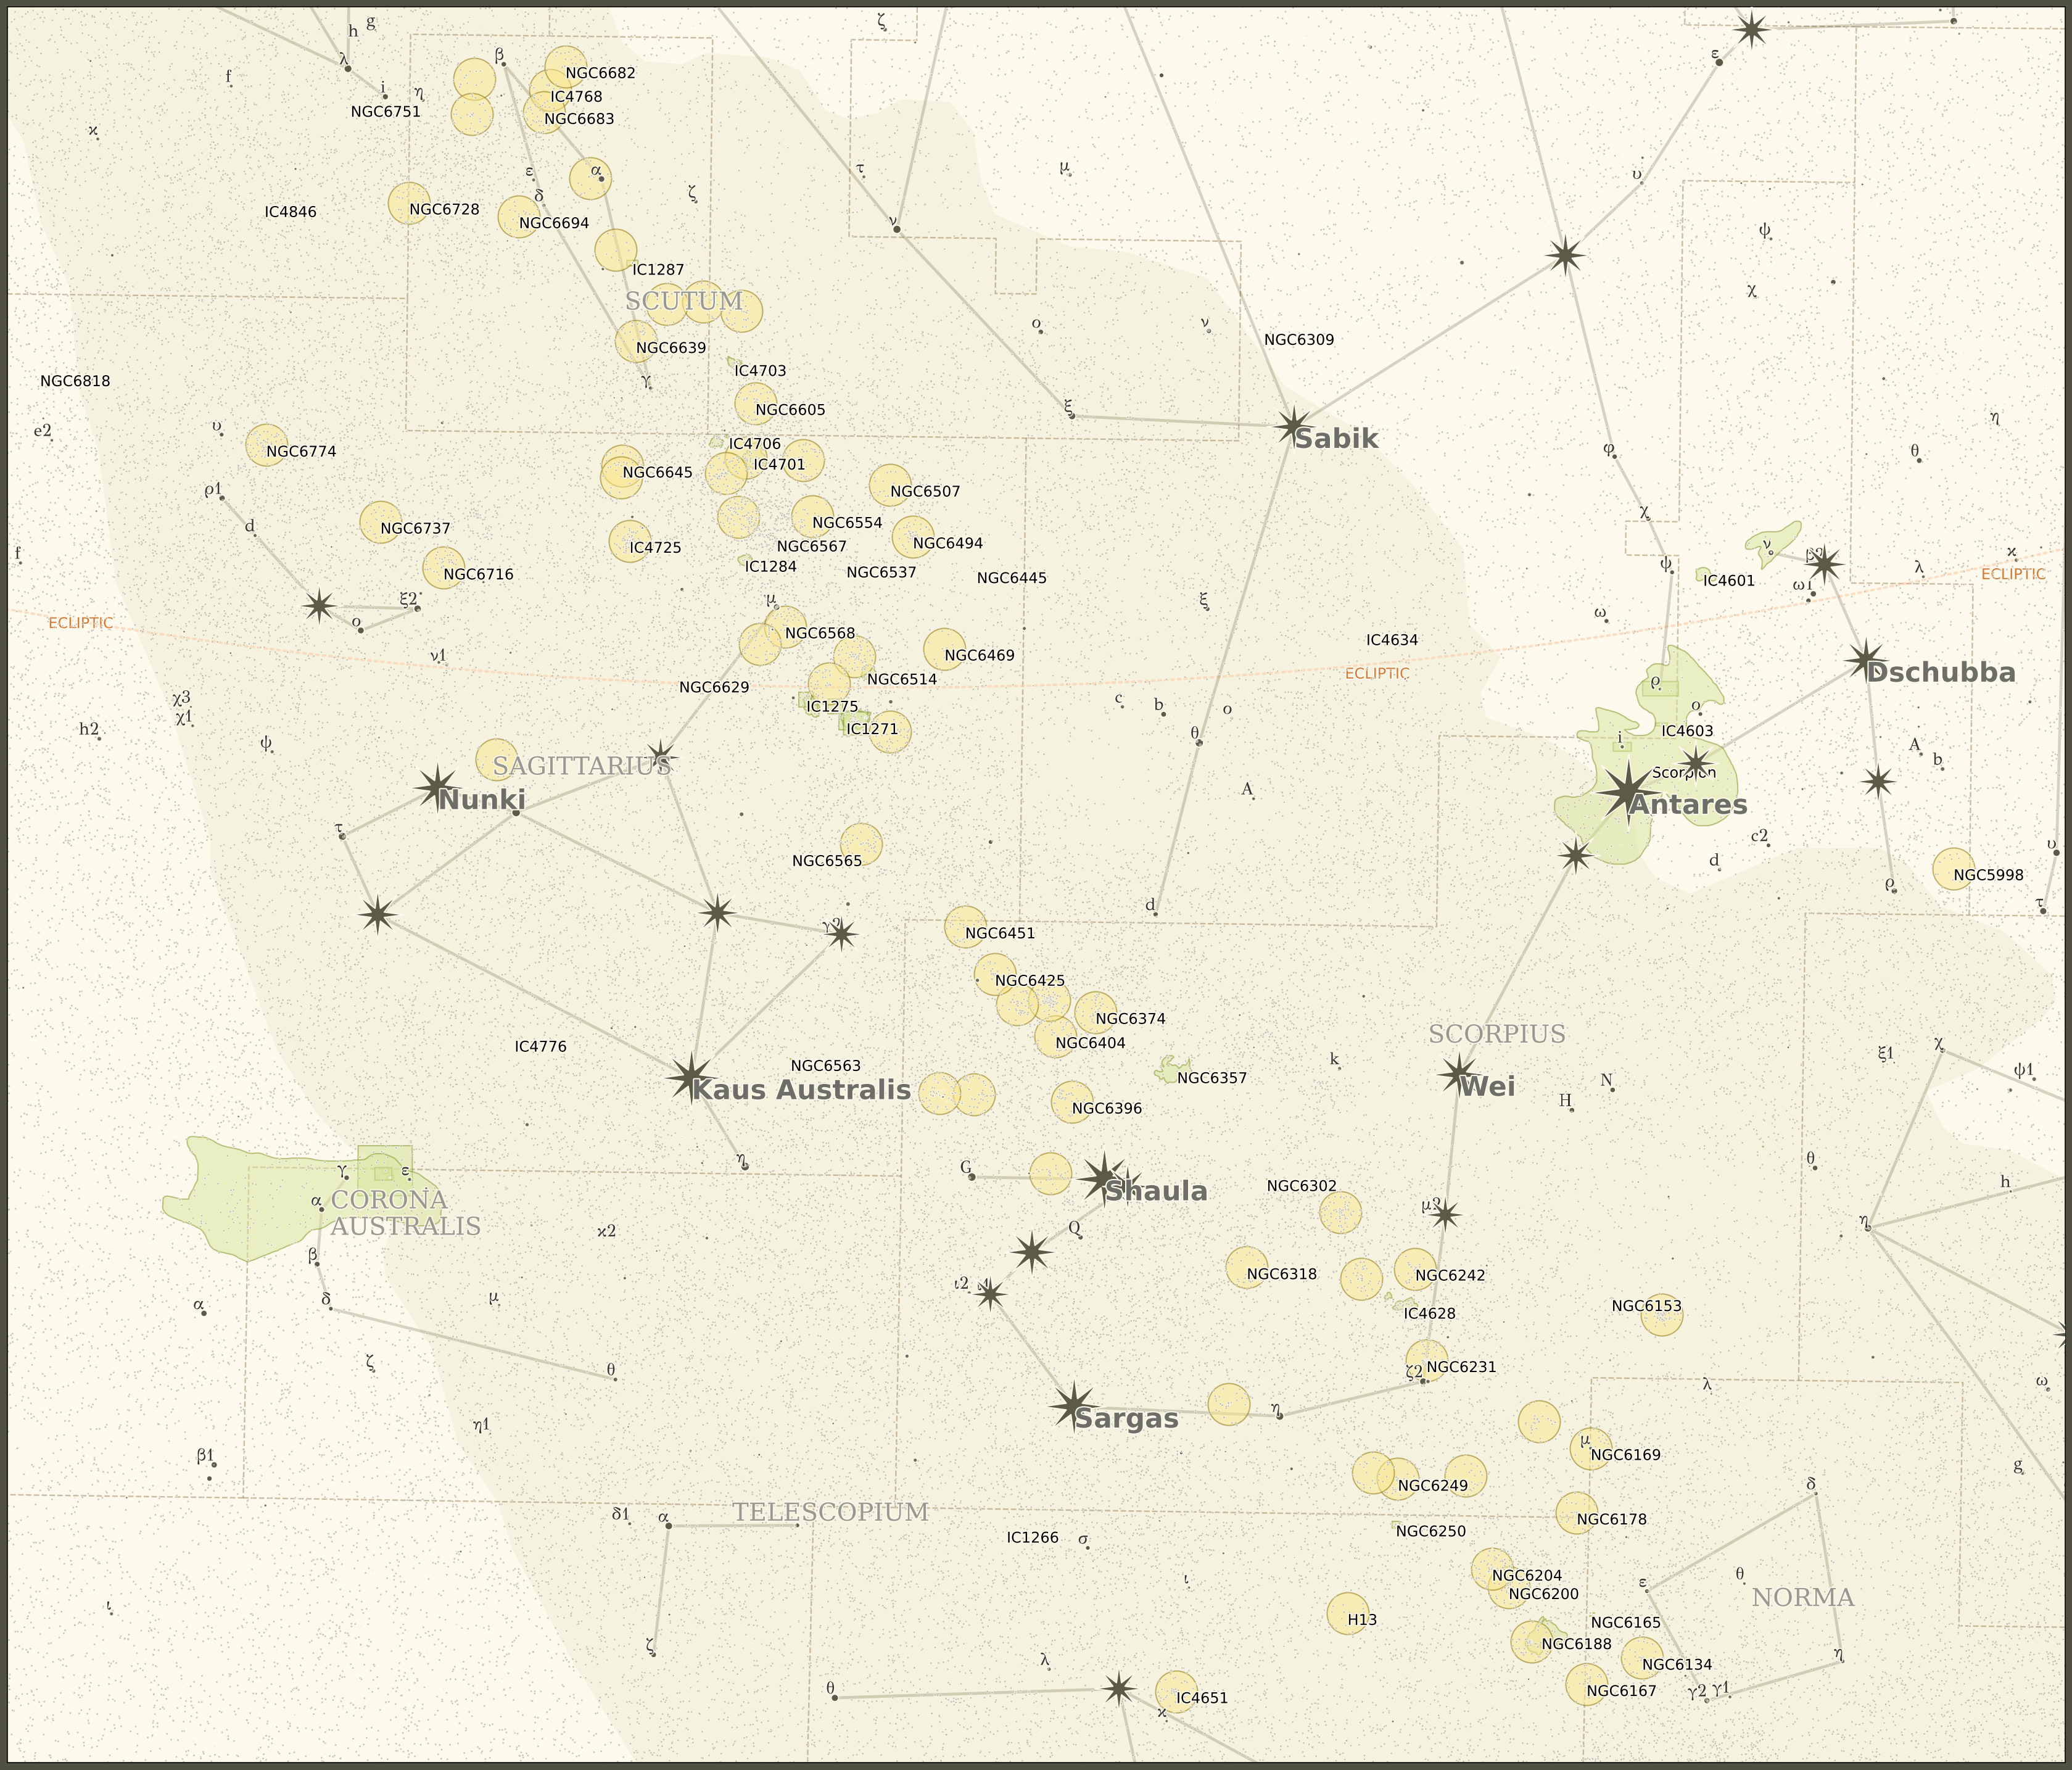
from starplot import MapPlot, Miller, callables, _
from starplot.styles import PlotStyle, extensions

style = PlotStyle().extend(
    # extensions.ANTIQUE,
    extensions.MAP,
)
p = MapPlot(
    projection=Miller(),
    ra_min=15.6 * 15,
    ra_max=19.8 * 15,
    dec_min=-45.2,
    dec_max=-3,
    style=style,
    resolution=4000,
    # autoscale=True,
)
p.constellations()
p.constellation_borders()

p.stars(
    where=[_.magnitude <= 3],
    style__marker__symbol="star_8",
    style__label__offset_x=8,
    style__label__offset_y=-8,
    style__label__stroke_width=2,
    style__label__stroke="#fefaed",
)
p.stars(
    where=[
        _.magnitude > 3,
        _.magnitude < 9,
    ],
    bayer_labels=True,
    flamsteed_labels=True,
)

p.nebula(
    where=[
        (_.magnitude.isnull()) | (_.magnitude < 12),
    ],
)
p.open_clusters(
    where=[
        (_.magnitude.isnull()) | (_.magnitude < 12),
    ],
    where_true_size=[False],
)
p.globular_clusters(
    where=[
        (_.magnitude.isnull()) | (_.magnitude < 12),
    ],
    where_true_size=[False],
)
p.ecliptic()
p.celestial_equator()
p.milky_way()
p.constellation_labels()
p.export("map_sagittarius.png")