Star Chart with More Detail
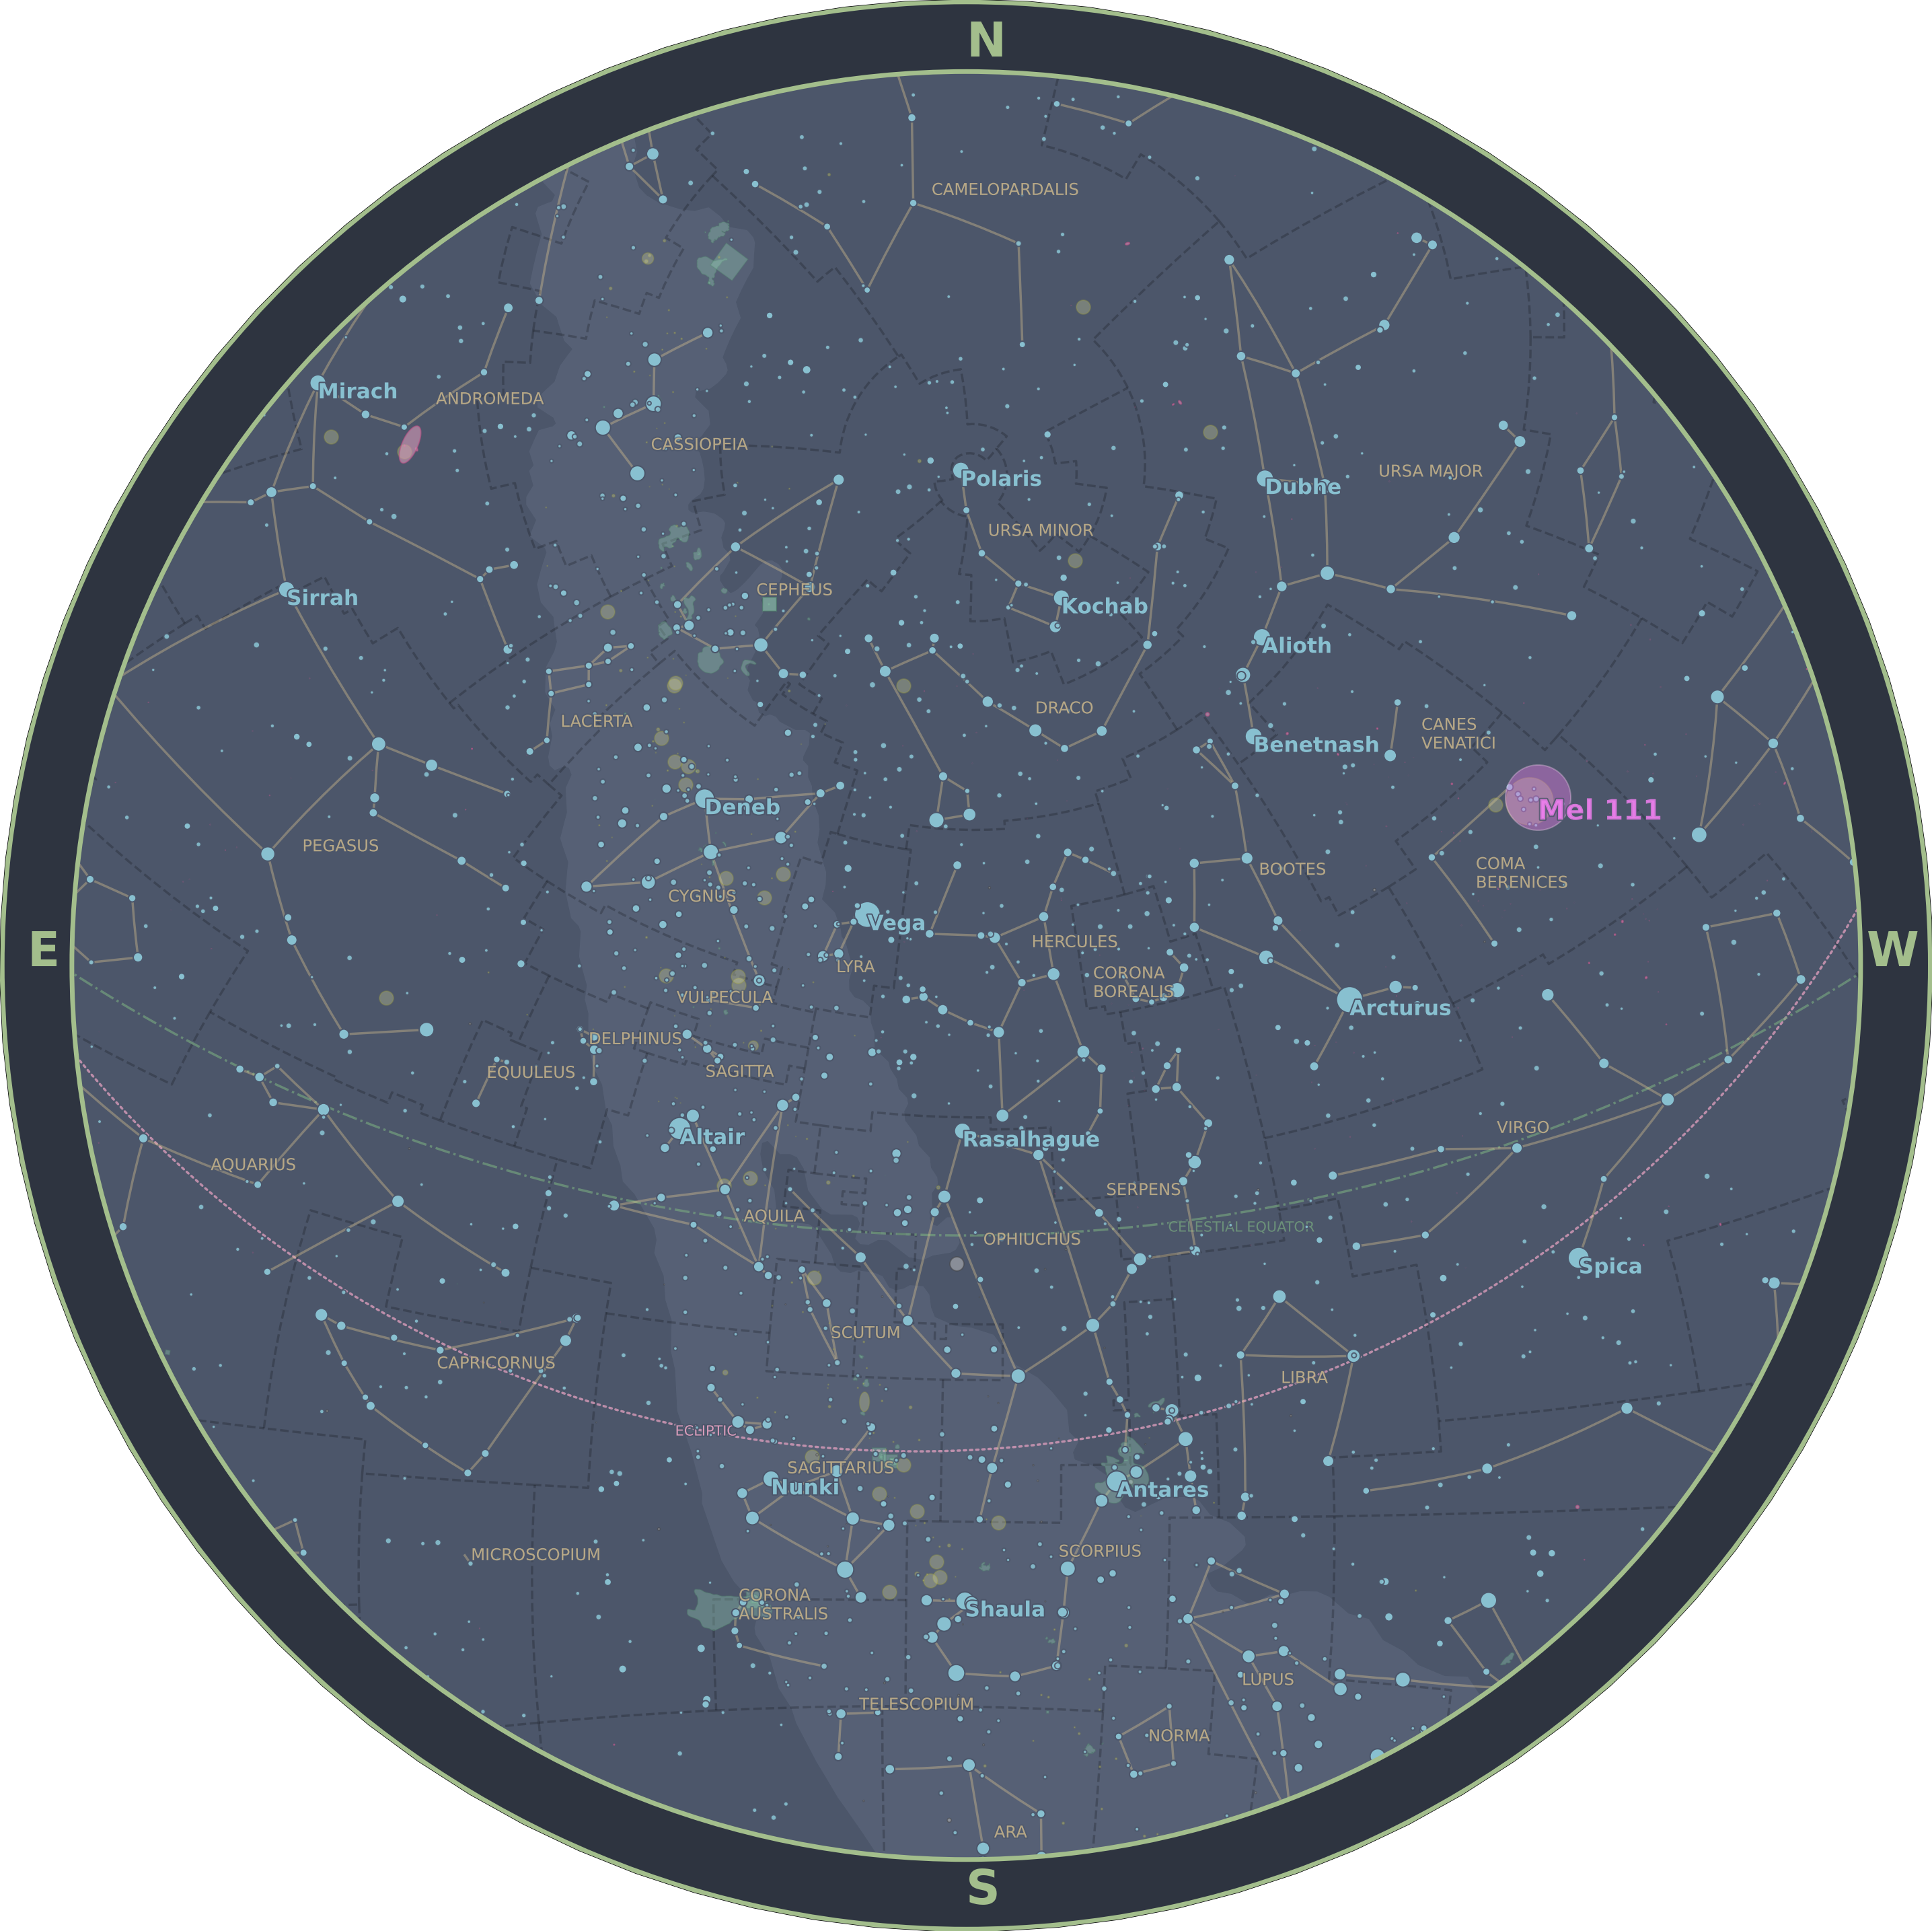
Building on the first example, you can also plot additional objects and even customize their style. Here's an example that plots a bunch of extra stuff (including the Milky Way, ecliptic, Deep Sky Objects, and more). It also demonstrates how you can plot your own markers, like the dashed yellow circle around the Coma Star Cluster (Melotte 111):
from datetime import datetime
from zoneinfo import ZoneInfo

from starplot import ZenithPlot, Observer, _
from starplot.styles import PlotStyle, extensions

tz = ZoneInfo("America/Los_Angeles")
dt = datetime(2023, 7, 13, 22, 0, tzinfo=tz)  # July 13, 2023 at 10pm PT

observer = Observer(
    dt=dt,
    lat=33.363484,
    lon=-116.836394,
)
p = ZenithPlot(
    observer=observer,
    style=PlotStyle().extend(
        extensions.BLUE_GOLD,
        extensions.GRADIENT_PRE_DAWN,
    ),
    resolution=3600,
    autoscale=True,
)
p.horizon()
p.constellations()
p.stars(where=[_.magnitude < 4.6], where_labels=[_.magnitude < 2.1])

p.galaxies(
    where=[_.magnitude < 9],
    where_labels=[False],
    where_true_size=[False],
)
p.open_clusters(
    where=[_.magnitude < 9],
    where_labels=[False],
    where_true_size=[False],
)

p.ecliptic()
p.celestial_equator()
p.milky_way()

p.marker(
    ra=12.36 * 15,
    dec=25.85,
    style={
        "marker": {
            "size": 60,
            "symbol": "circle",
            "fill": "none",
            "color": None,
            "edge_color": "hsl(44, 70%, 73%)",
            "edge_width": 2,
            "line_style": [1, [2, 3]],
            "alpha": 1,
            "zorder": 100,
        },
        "label": {
            "zorder": 200,
            "font_size": 22,
            "font_weight": 700,
            "font_color": "hsl(44, 70%, 64%)",
            "font_alpha": 1,
            "offset_x": "auto",
            "offset_y": "auto",
            "anchor_point": "top right",
        },
    },
    label="Mel 111",
)
p.constellation_labels()

p.export("star_chart_detail.png", transparent=True, padding=0.1)