Horizon Gradient
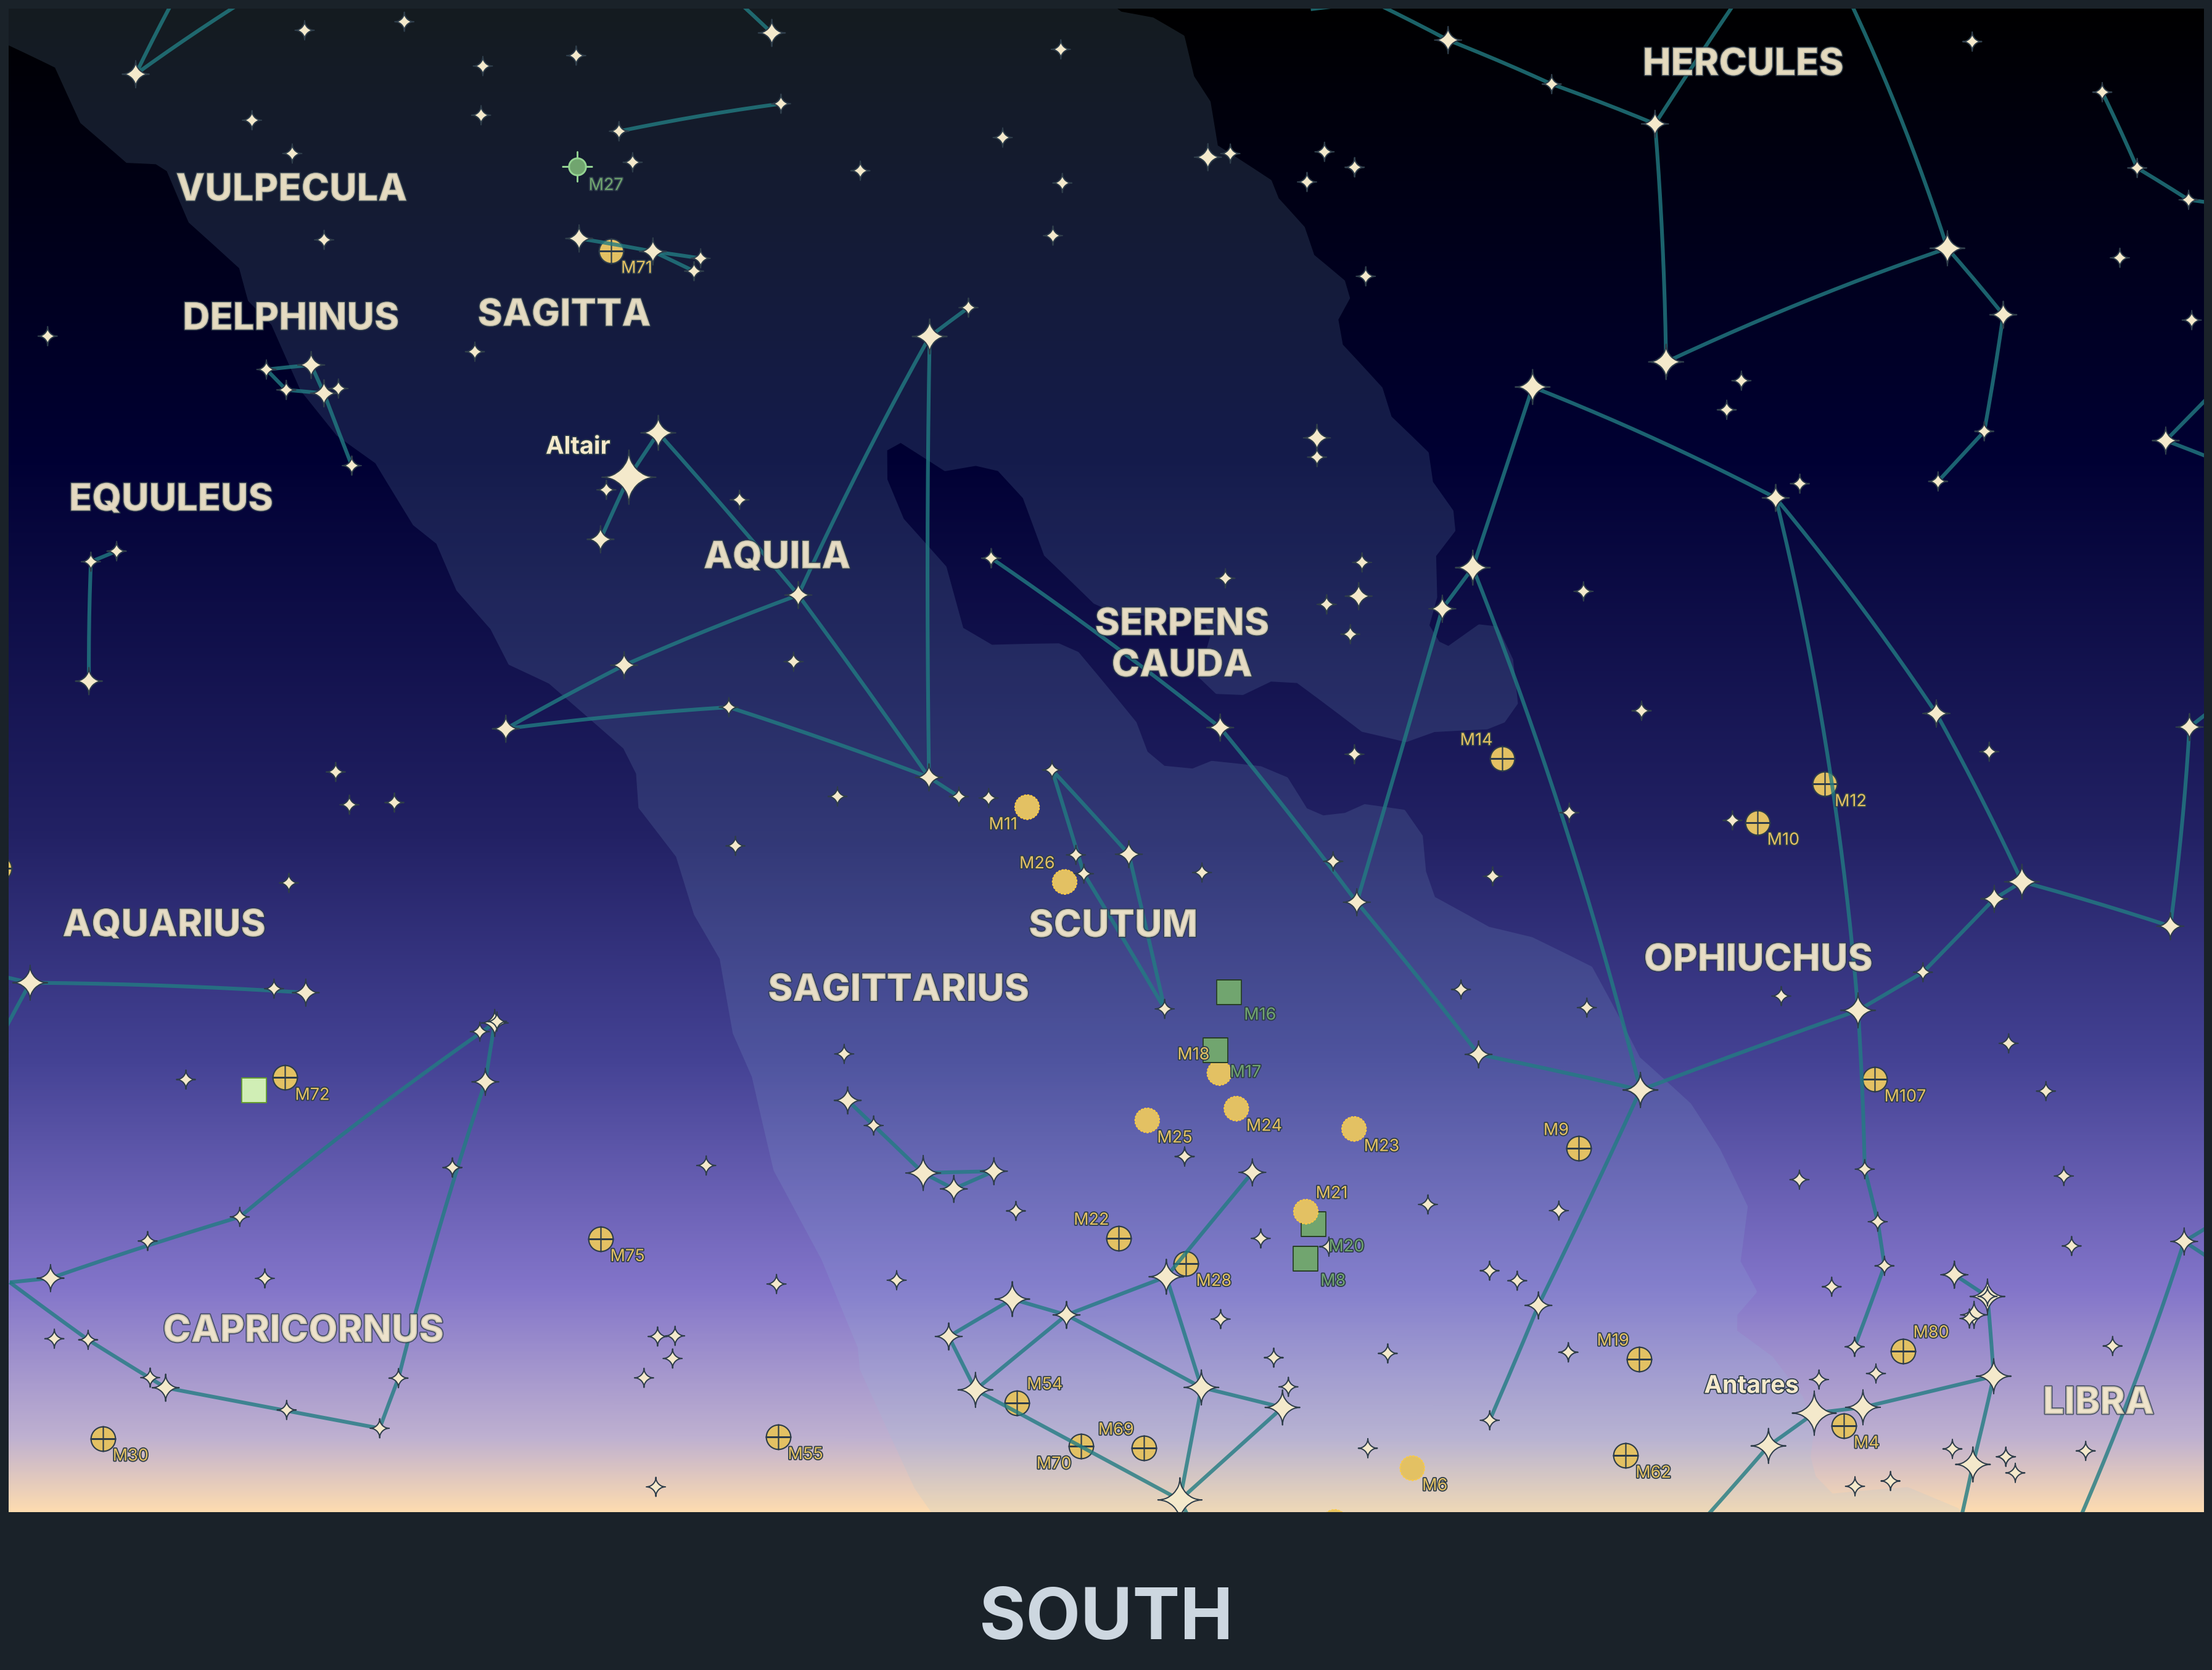
This plot shows what was in the sky when looking south from the Mauna Kea Observatories on August 20, 2025 at 9pm. Gradients have been used on the background, stars, and ground. Learn more about using gradients...
from datetime import datetime
from zoneinfo import ZoneInfo

from starplot import HorizonPlot, Observer, callables, _
from starplot.styles import PlotStyle, extensions, gradients

style = PlotStyle().extend(
    extensions.BLUE_GOLD,
    extensions.HORIZON,
    extensions.GRADIENT_PRE_DAWN,
)
style.figure.padding = 40
style.constellation_lines.width = 4
style.star.marker.stroke_width = 0

dt = datetime(2025, 8, 20, 21, 0, 0, 0, tzinfo=ZoneInfo("Pacific/Honolulu"))

observer = Observer(
    lat=19.8222,  # Mauna Kea Observatories
    lon=-155.4749,
    dt=dt,
)

p = HorizonPlot(
    altitude=(0, 60),
    azimuth=(155, 250),
    observer=observer,
    style=style,
    scale=1.2,
)

p.ground(
    min_altitude=3.5,
    max_altitude=6,
    style__fill={
        "stops": gradients.GROUND,
        "type": "linear",
    },
)
p.constellations()
p.milky_way()
p.gridlines()

p.stars(
    where=[_.magnitude < 4.6],
    where_labels=[_.magnitude < 2],
    color_fn=callables.color_by_bv_gradient,
)

p.messier(
    where=[_.magnitude < 11],
    where_true_size=[False],
)

p.constellation_labels()

p.export("horizon_gradient.png")