The Milky Way
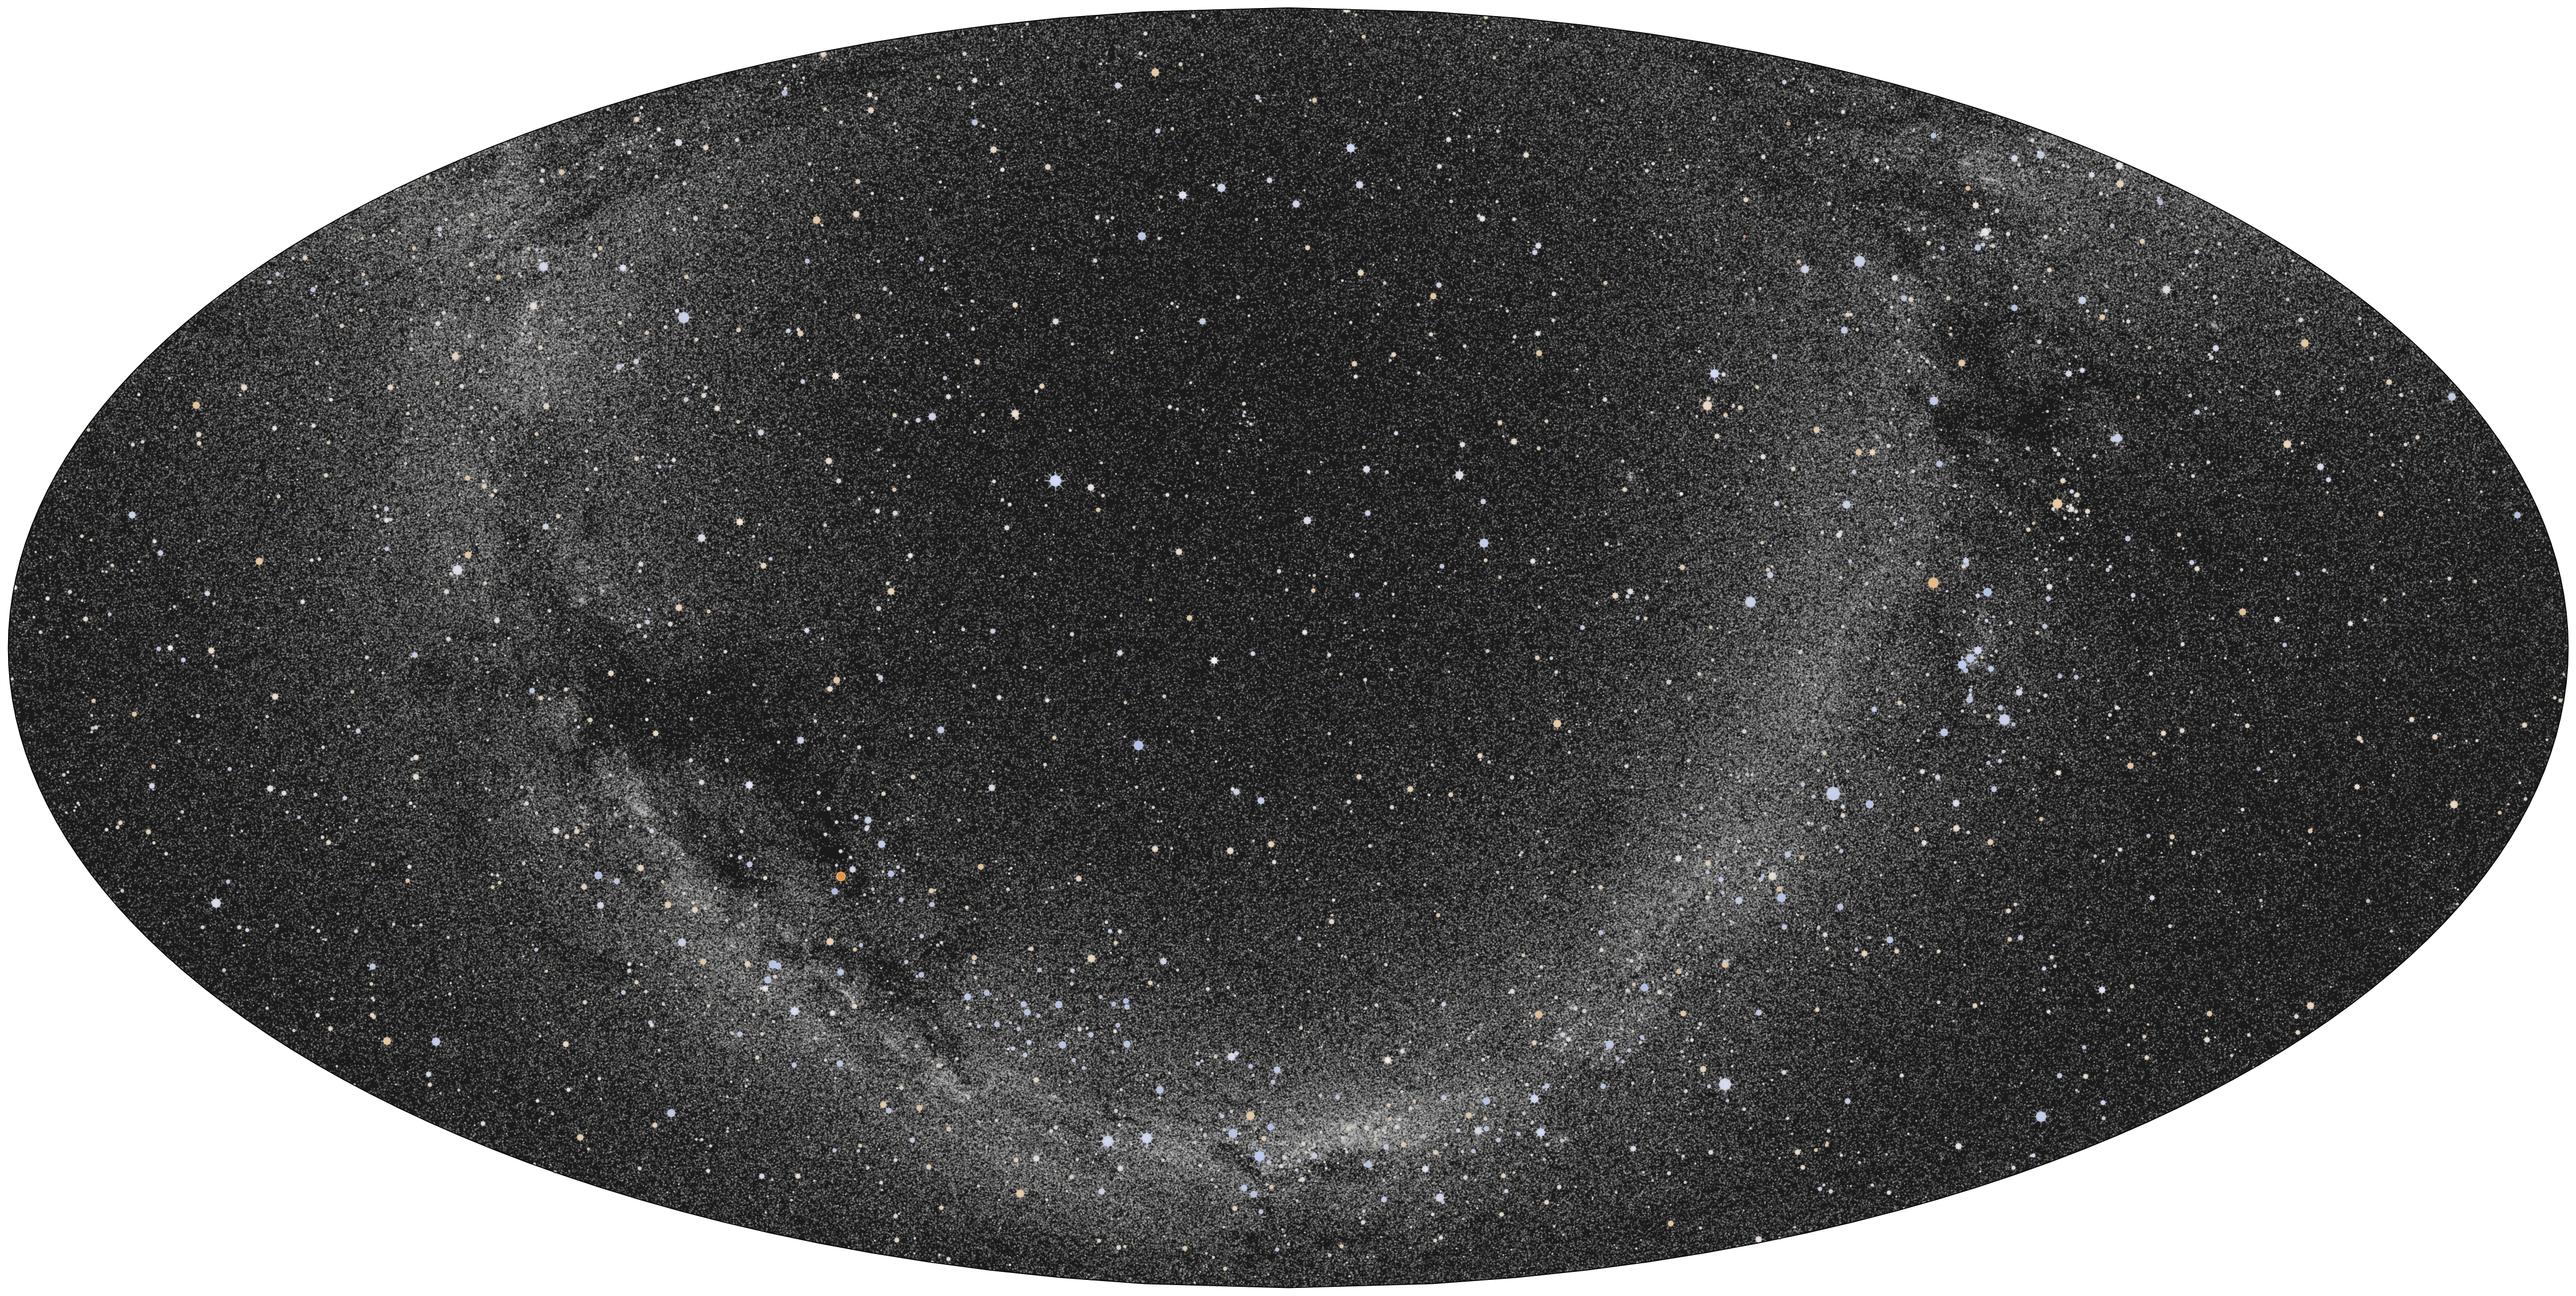
In this example, we first plot all stars with a limiting magnitude of 11, which clearly shows the Milky Way. And then we use Pillow to apply a median filter, which helps make the Milky Way stand out more in the image.
from PIL import Image, ImageFilter

from starplot import MapPlot, Mollweide, _
from starplot.data.catalogs import BIG_SKY
from starplot.styles import PlotStyle, extensions

style = PlotStyle().extend(
    extensions.GRAYSCALE_DARK,
    extensions.MAP,
    extensions.FIGURE_TRANSPARENT,
)

p = MapPlot(
    projection=Mollweide(),
    style=style,
    resolution=4800,
    scale=0.36,
)
p.stars(
    where=[_.magnitude < 12],
    where_labels=False,
    opacity_fn=lambda s: 0.9 if s.magnitude < 9 else 0.6,
    catalog=BIG_SKY,
    style__marker__stroke="#fff",
)
p.export("map_milky_way_stars.png")

# apply a median filter to increase contrast
with Image.open("map_milky_way_stars.png") as img:
    filtered = img.filter(ImageFilter.MedianFilter(size=5))
    filtered.save("map_milky_way_stars.png")