Image Overlay on an Optic Plot
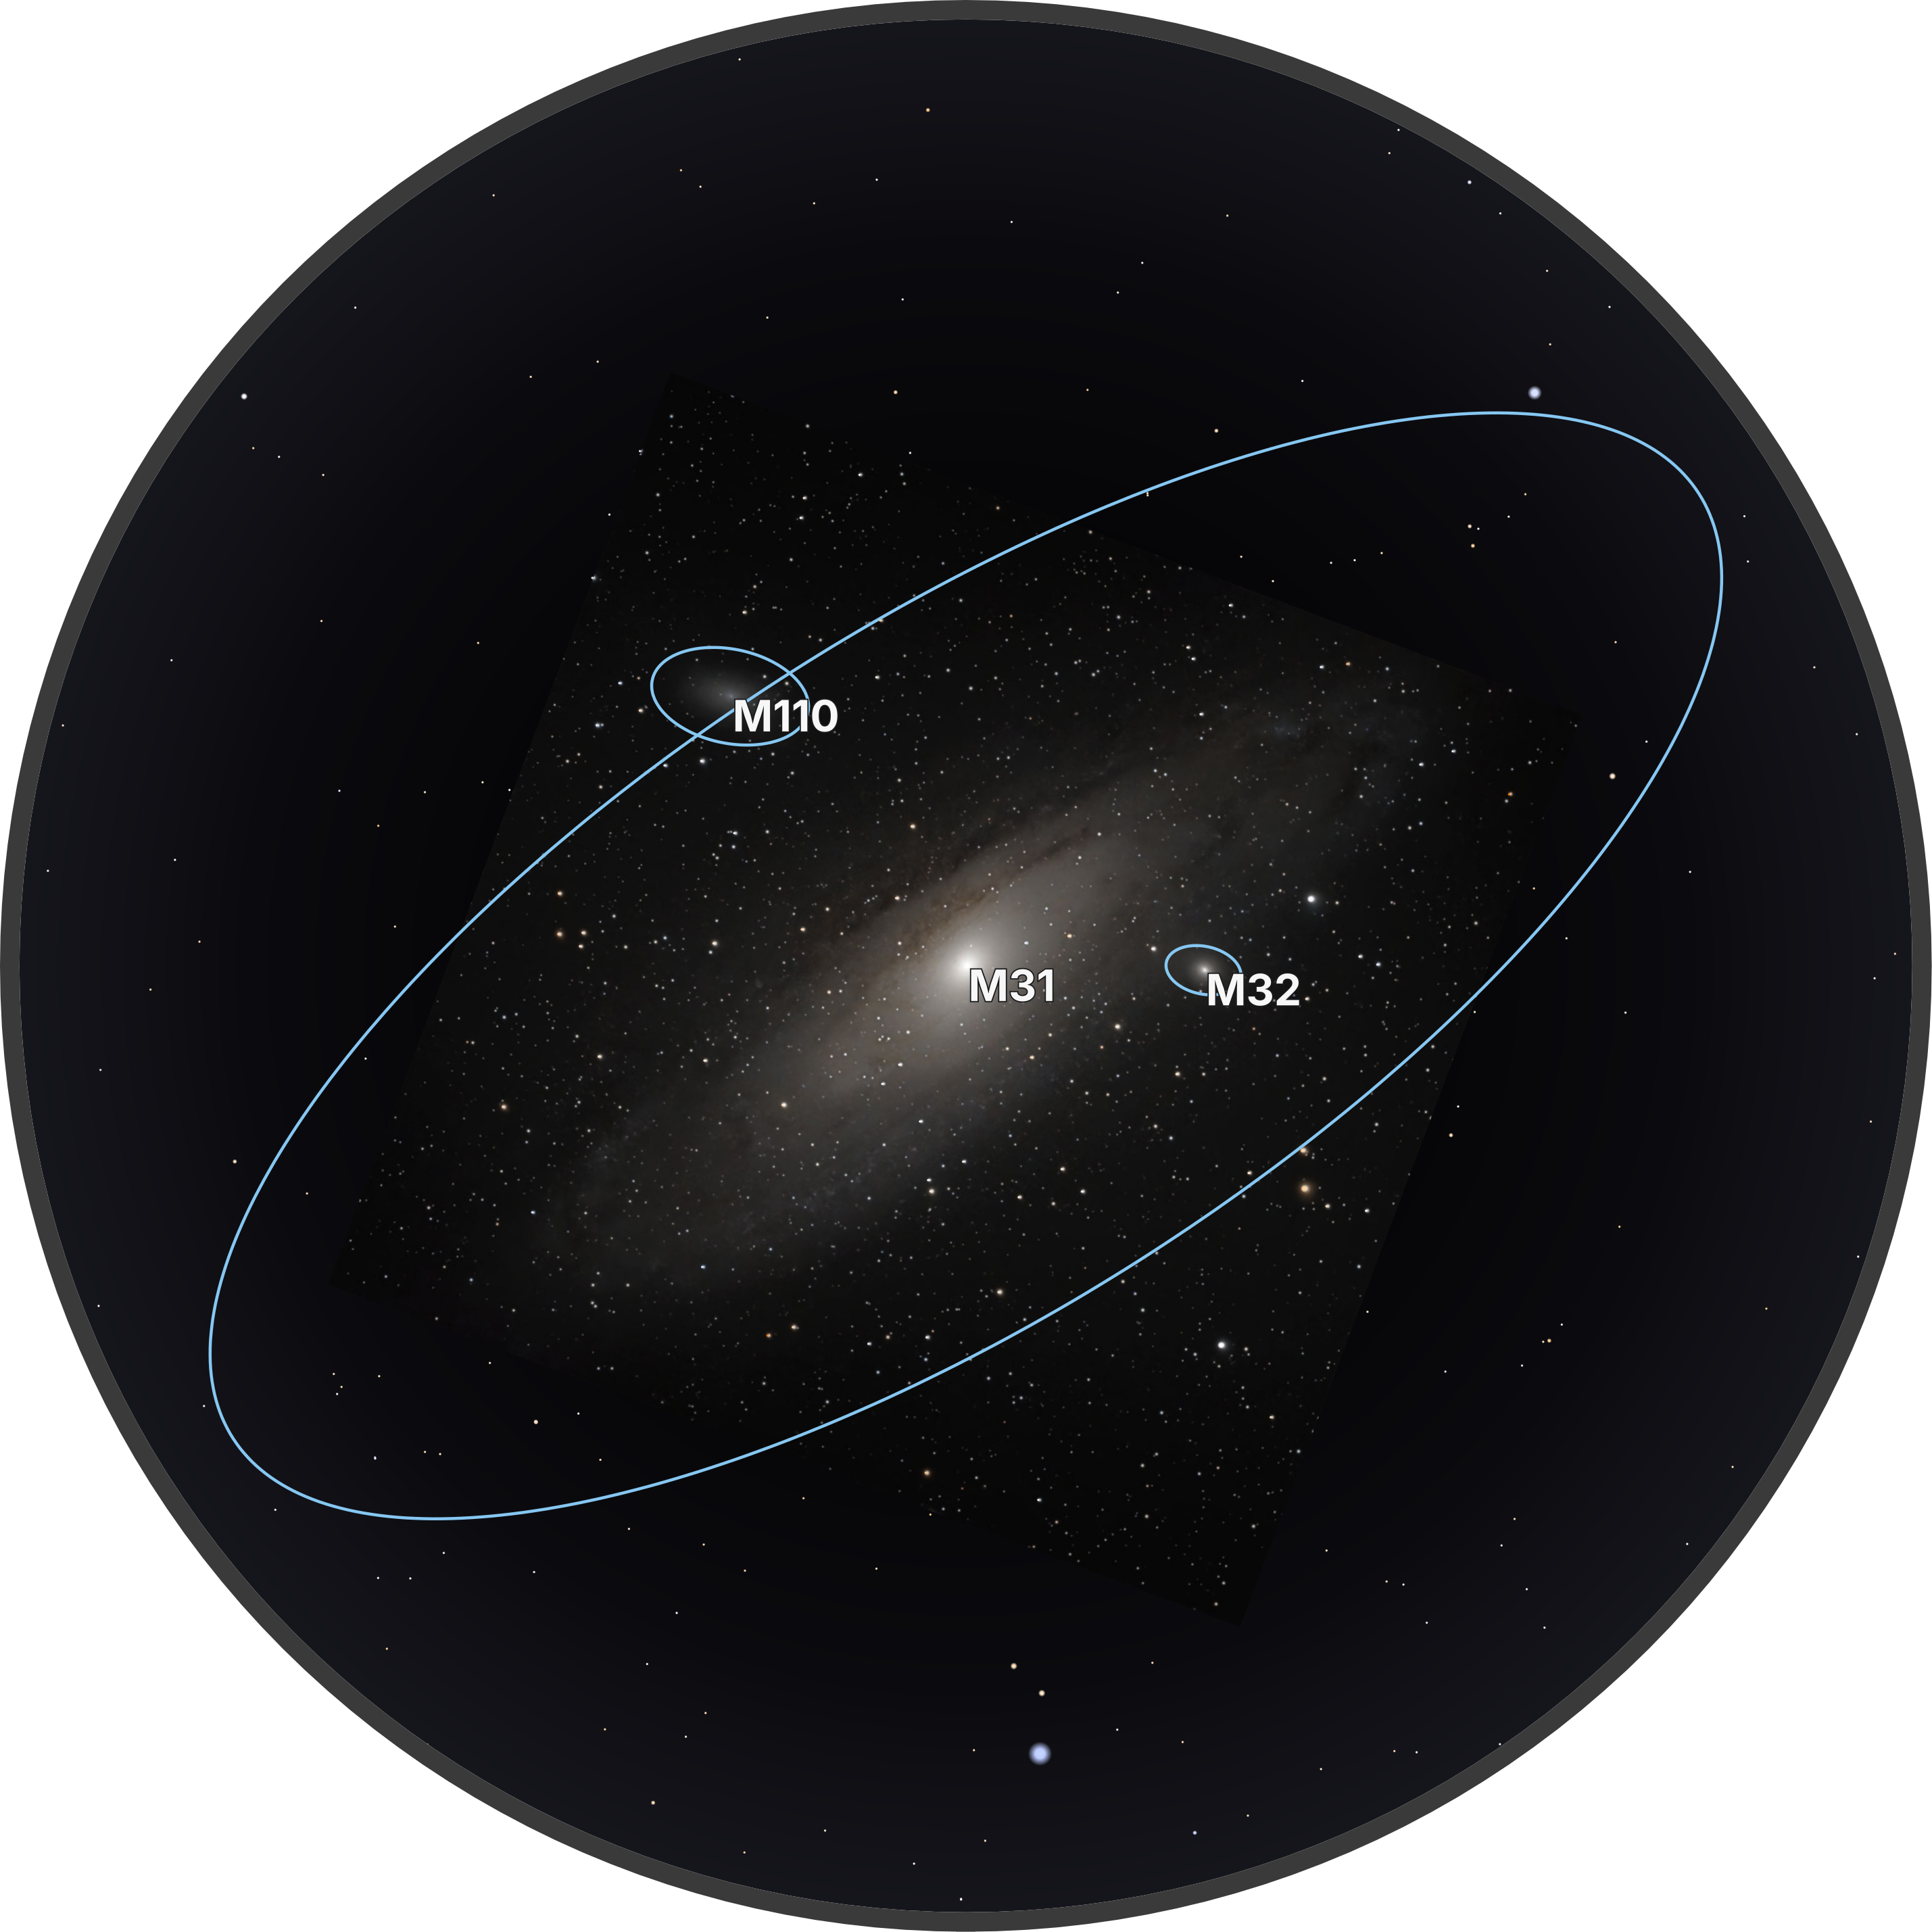
Here's an example of plotting an image of the Andromeda Galaxy (M31) on an optic plot. The image is aligned to the sky using control points, which map pixel positions in the image with the known RA/DEC of the stars at those positions. You can use a plate solver like tetra3rs to find these control points automatically.
from datetime import datetime
from pathlib import Path
from zoneinfo import ZoneInfo

from starplot import DSO, Observer, OpticPlot, Scope, callables, _
from starplot.styles import PlotStyle, extensions


IMAGE = Path(__file__).parent / "andromeda.jpeg"
IMAGE_SIZE = (1200, 1200)

# Control points that match a pixel position in the image with
# its sky position: ((x, y), (ra, dec)) in degrees.
CONTROL_POINTS = [
    ((231.9, 870.0), (10.5060, 40.6883)),  # HIP 3293
    ((113.8, 533.3), (11.1549, 40.6794)),  # HIP 3494
    ((141.9, 316.8), (11.5135, 40.8089)),  # HIP 3597
    ((132.2, 576.7), (11.0697, 40.6852)),  # HIP 3461
    ((751.0, 404.0), (11.0162, 41.5709)),  # HIP 3447
    ((421.1, 281.7), (11.4187, 41.1902)),  # TYC 2801-1743-1
    ((543.3, 368.3), (11.1977, 41.3136)),  # TYC 2805-117-1
    ((400.3, 638.7), (10.8089, 41.0094)),  # TYC 2801-2078-1
    ((426.8, 41.7), (11.8345, 41.2989)),  # TYC 2805-39-1
    ((1083.7, 503.7), (10.6477, 41.9630)),  # TYC 2805-695-1
    ((1073.0, 280.3), (11.0473, 42.0458)),  # TYC 2805-1072-1
    ((392.6, 744.0), (10.6292, 40.9537)),  # HIP 3333
    ((993.9, 765.0), (10.2416, 41.7309)),  # HIP 3223
    ((900.8, 560.2), (10.6563, 41.6994)),  # TYC 2805-789-1
    ((1130.1, 761.1), (10.1676, 41.9105)),  # TYC 2805-1240-1
    ((643.1, 152.1), (11.5197, 41.5368)),  # TYC 2805-700-1
]

# custom gradient background
NIGHT_SUBTLE = (
    (0.0, "hsl(240, 14%, 10%)"),
    (0.25, "hsl(240, 14%, 5%)"),
    (0.6, "hsl(240, 14%, 2%)"),
    (1.0, "#000000"),
)

m31 = DSO.get(m="31")

observer = Observer(
    dt=datetime(2026, 10, 13, 21, 0, 0, tzinfo=ZoneInfo("US/Pacific")),
    lat=33.363484,
    lon=-116.836394,
)

style = PlotStyle().extend(
    extensions.GRAYSCALE_DARK,
    extensions.OPTIC,
    {
        "axes": {
            "background": {"fill": {"stops": NIGHT_SUBTLE, "type": "radial"}},
            "border": {
                "stroke": "#3A3A3A",
                "width": 32,
            },
        }
    },
    extensions.FIGURE_TRANSPARENT,
)

# outline the galaxies instead of filling them, so the photo shows through
style.dso_galaxy.marker.fill = None
style.dso_galaxy.marker.stroke = "#86c7f2"
style.dso_galaxy.marker.stroke_width = 5
style.dso_galaxy.marker.opacity = 1

style.dso_galaxy.label.font_size = 72
style.dso_galaxy.label.font_weight = 700

p = OpticPlot(
    ra=m31.ra,
    dec=m31.dec,
    optic=Scope(focal_length=714, eyepiece_focal_length=28, eyepiece_fov=82),
    observer=observer,
    resolution=2800,
    scale=0.9,
    style=style,
)

p.image(IMAGE, CONTROL_POINTS)

p.stars(
    where=[_.magnitude < 12],
    color_fn=callables.color_by_bv_gradient,
    style__marker__stroke=None,
)

# plot Andromeda (M31) and its satellite galaxies (M32, M110)
p.dsos(
    where=[_.m.isin([31, 32, 110])],
    where_true_size=True,
)

p.export("optic_image_overlay.png")